A Definitive Guide to Cumulative Volume Delta (CVD)
- What does CVD Measure?
Cumulative volume delta measures the difference in aggressive buyers and sellers. It displays the side with the larger difference in volume, and it's amount, within each candlestick.
- When a CVD rises, overall there are more aggressive buyers (market orders)
- When a CVD falls, there are more aggressive sellers present
- When a CVD is flat, it represents indecision, and neither side is meaningfully aggressive
CVD tracks the effort of the participants in a given timeframe.
2. Types of CVD's
The Cumulative Volume Delta has several variants, each showing a different side of the markets behavior.
- Taker CVD - Most common, tracks the aggression of market orders in real time.
- Maker CVD - Less common, quite valuable. Shows behavior of passive liquidity (limit orders) and whether they're absorbing price, or not interested.
- Spot CVD - Tracks aggressive volume (market orders) of spot exchanges. This is the stronger demand, it requires actual capital, therefore it is more meaningful in the long term.
- Perpetual CVD - Tracks aggressive volume in perpetual futures markets, shorter term speculation, and highly leveraged.
- Aggregated CVD - La Creme de la creme, provided on Kiyotaka.ai, removes possible single exchange distortion and highlights overall global aggressive flow.
3. Maker vs Taker
The common CVD highlights the behavior of takers (market orders) though being able to functionally use the CVD requires the knowledge of how makers (limit orders) respond.
- Initiative/Taker - Takers push price only if liquidity is thin enough (not enough makers/limit orders) which allows them to continue forward. A rising CVD can be an illusion to the fool if many makers are present.
- Response/Maker - Makers absorb market orders through the use of limit orders, when absorption is present, the CVD may go in one direction very aggressively, but price will barely move in that same direction.
When takers are starting to fail, this is clearly illustrated through a strong CVD and little price movement, again, the volume increases, but price displacement shrinks. This is called absorption, and we will cover this next.
4. The 2 Fundamental Divergences
4 1.) Absorption Divergences (Strongest)
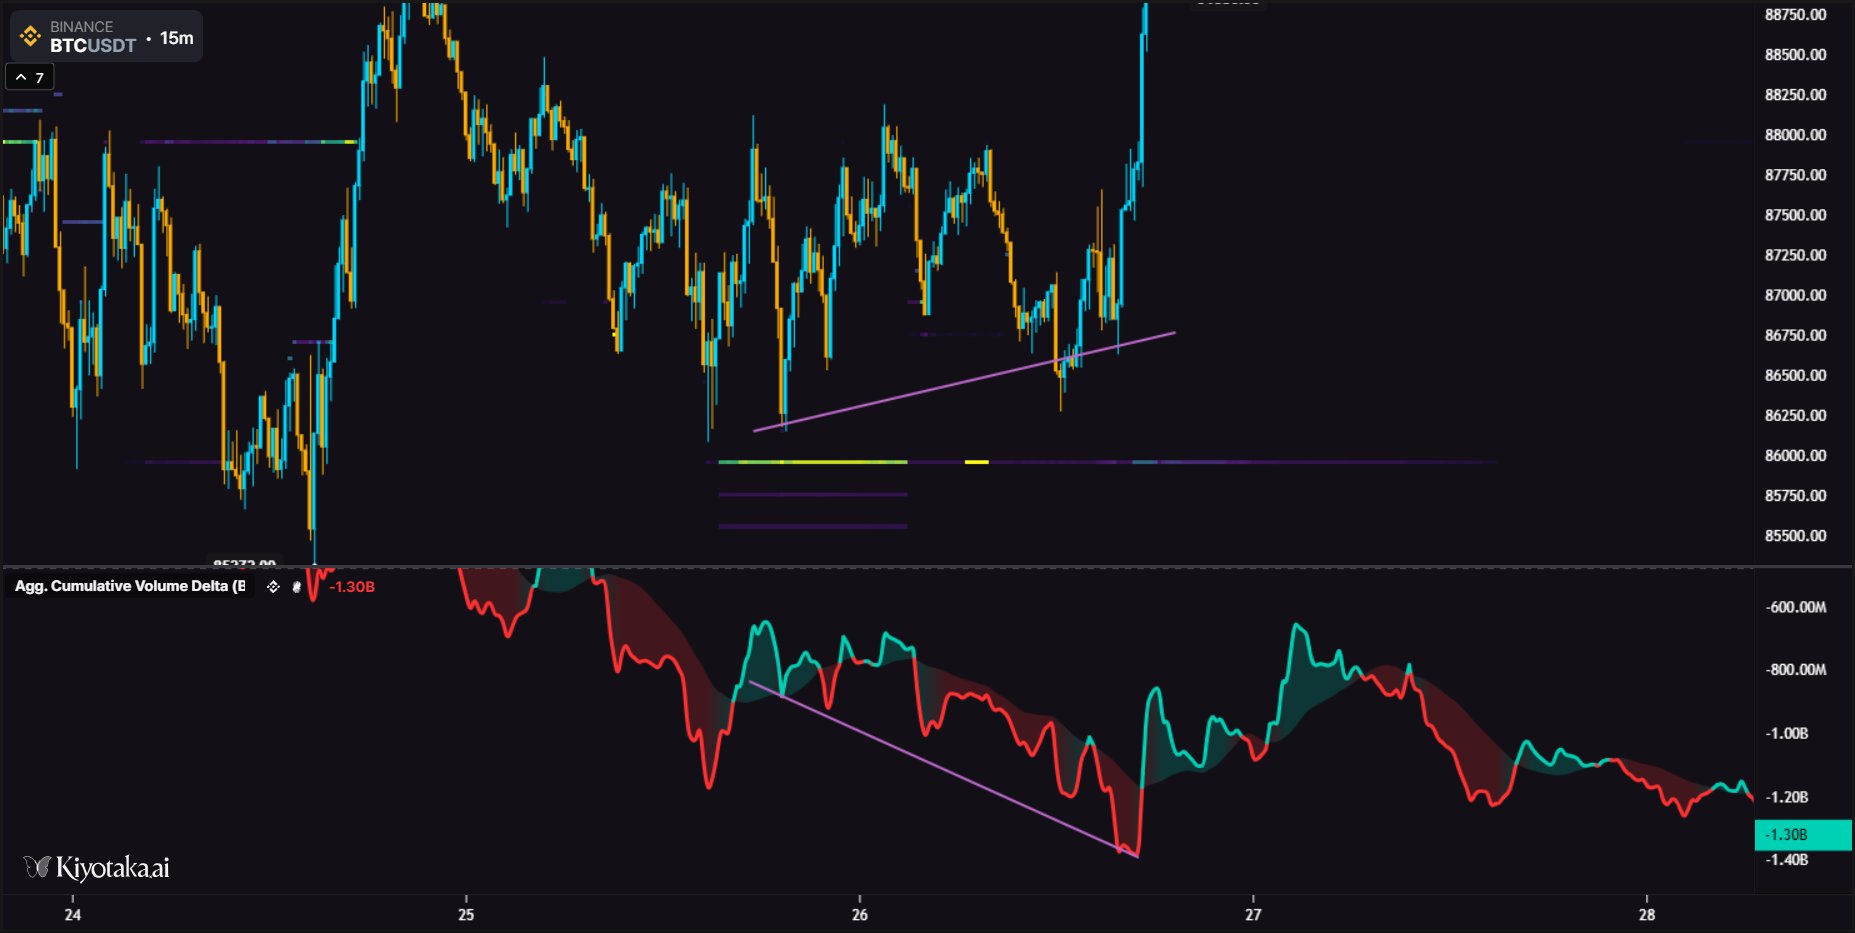
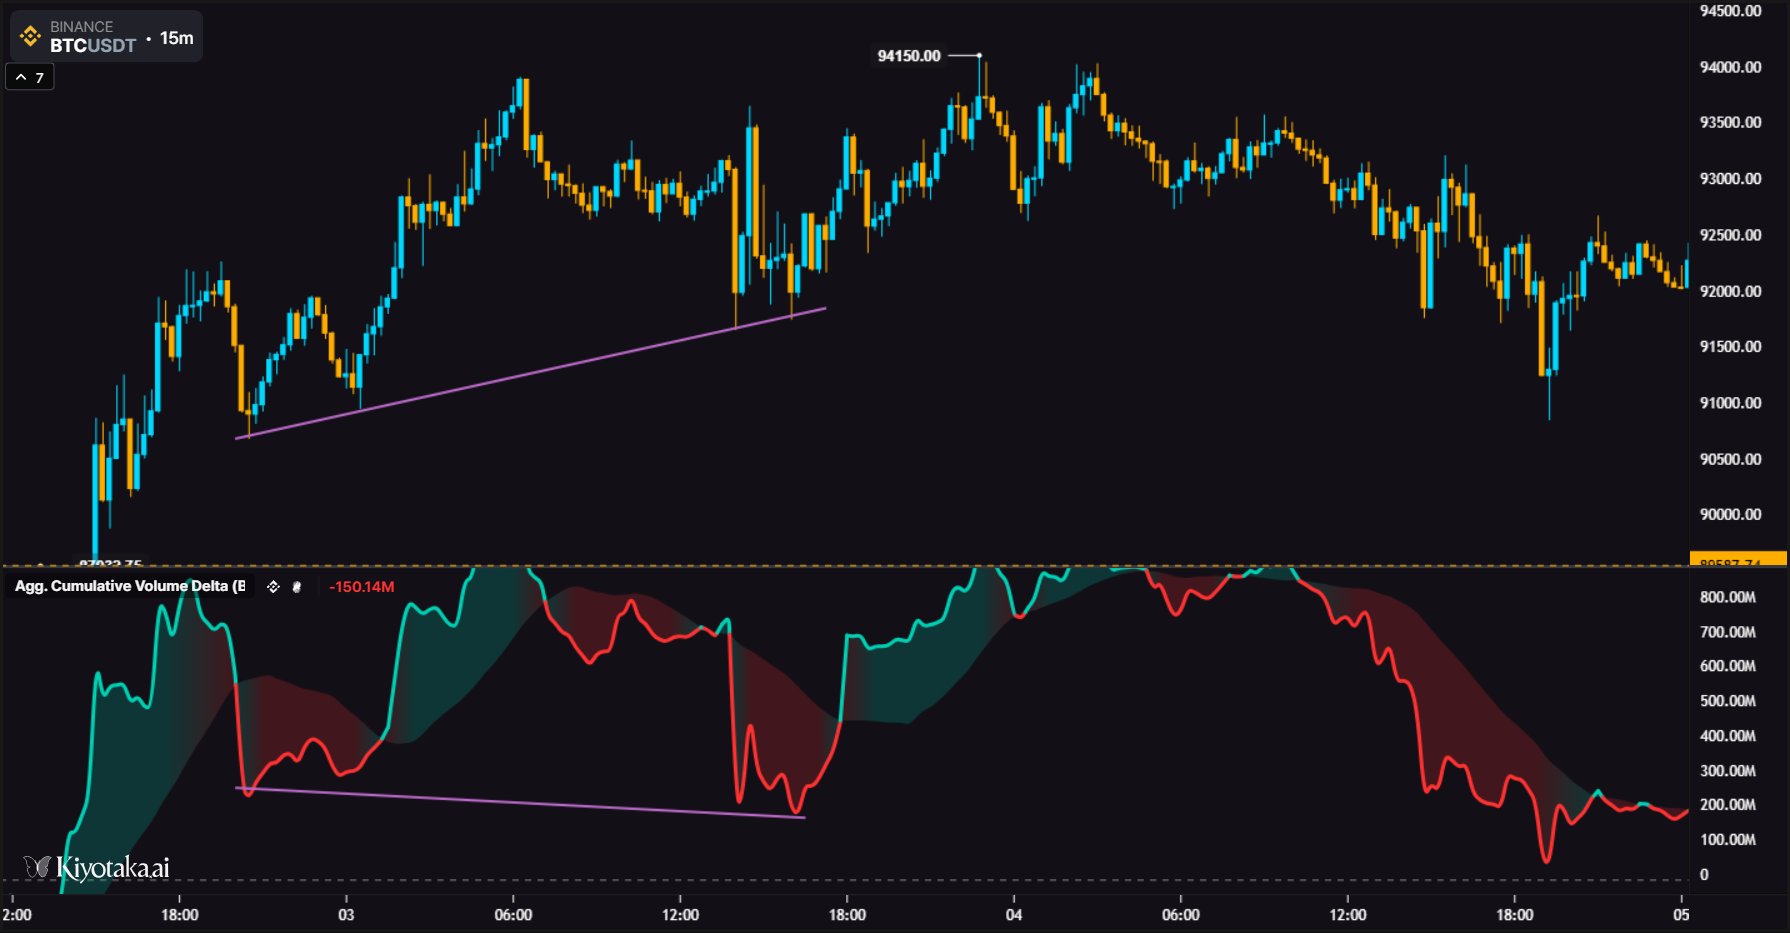
If the CVD goes in one direction, but price fails to continue in that same direction with the CVD, there are hidden limit orders absorbing aggressive market orders. (We can see these limit orders with a heatmap)
Buying Absorption - CVD up, price is down. Aggressive market buy orders being absorbed by hidden limit sell orders.
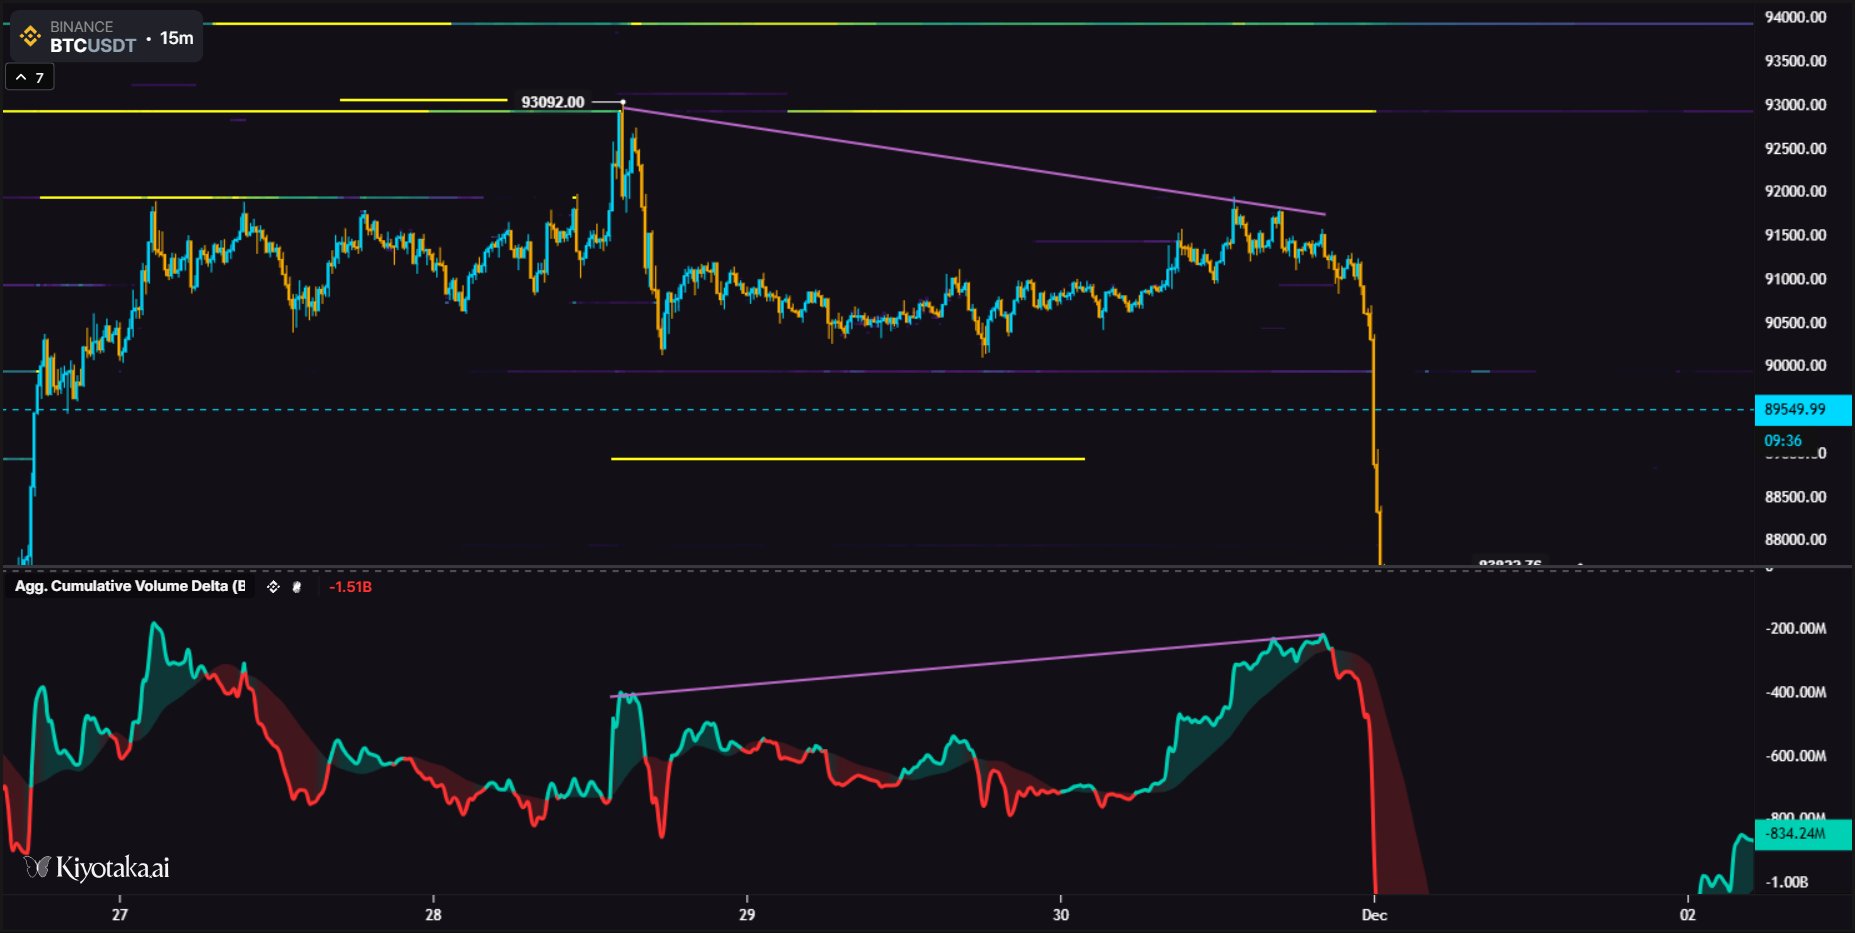
Selling Absorption - CVD down, price up. Aggressive market sell orders being absorbed by hidden limit buy orders.
4 2.) Exhaustion Divergences (More Common)
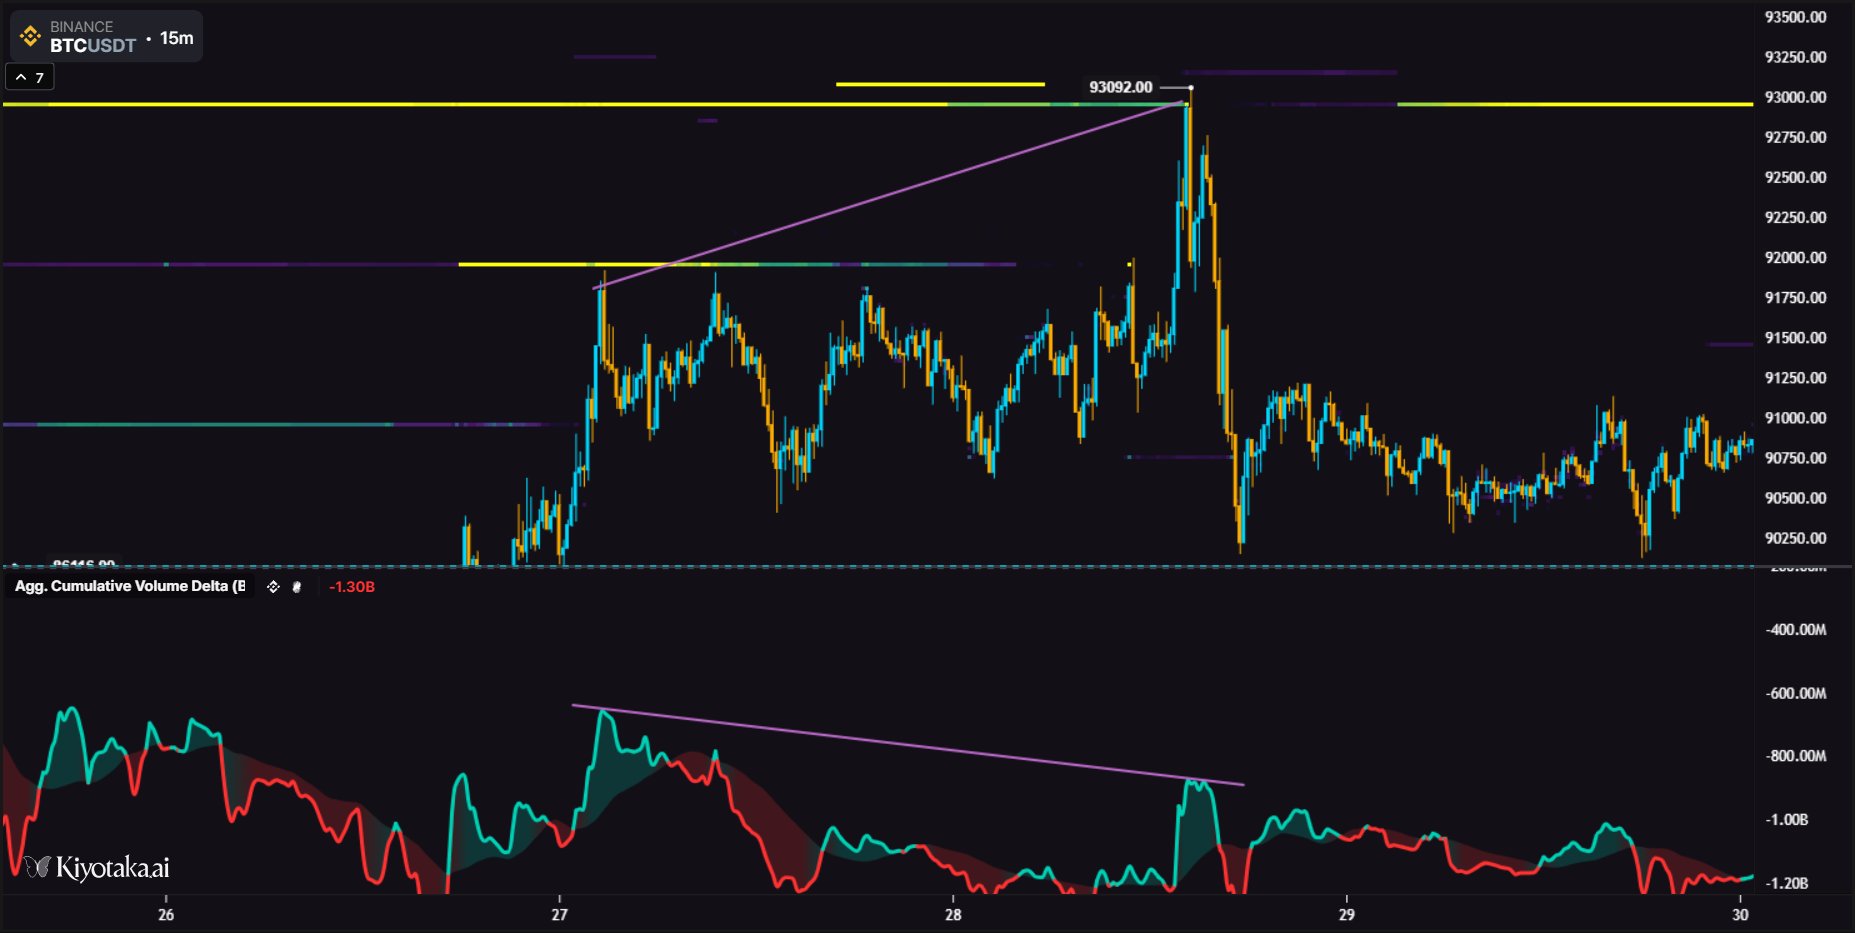
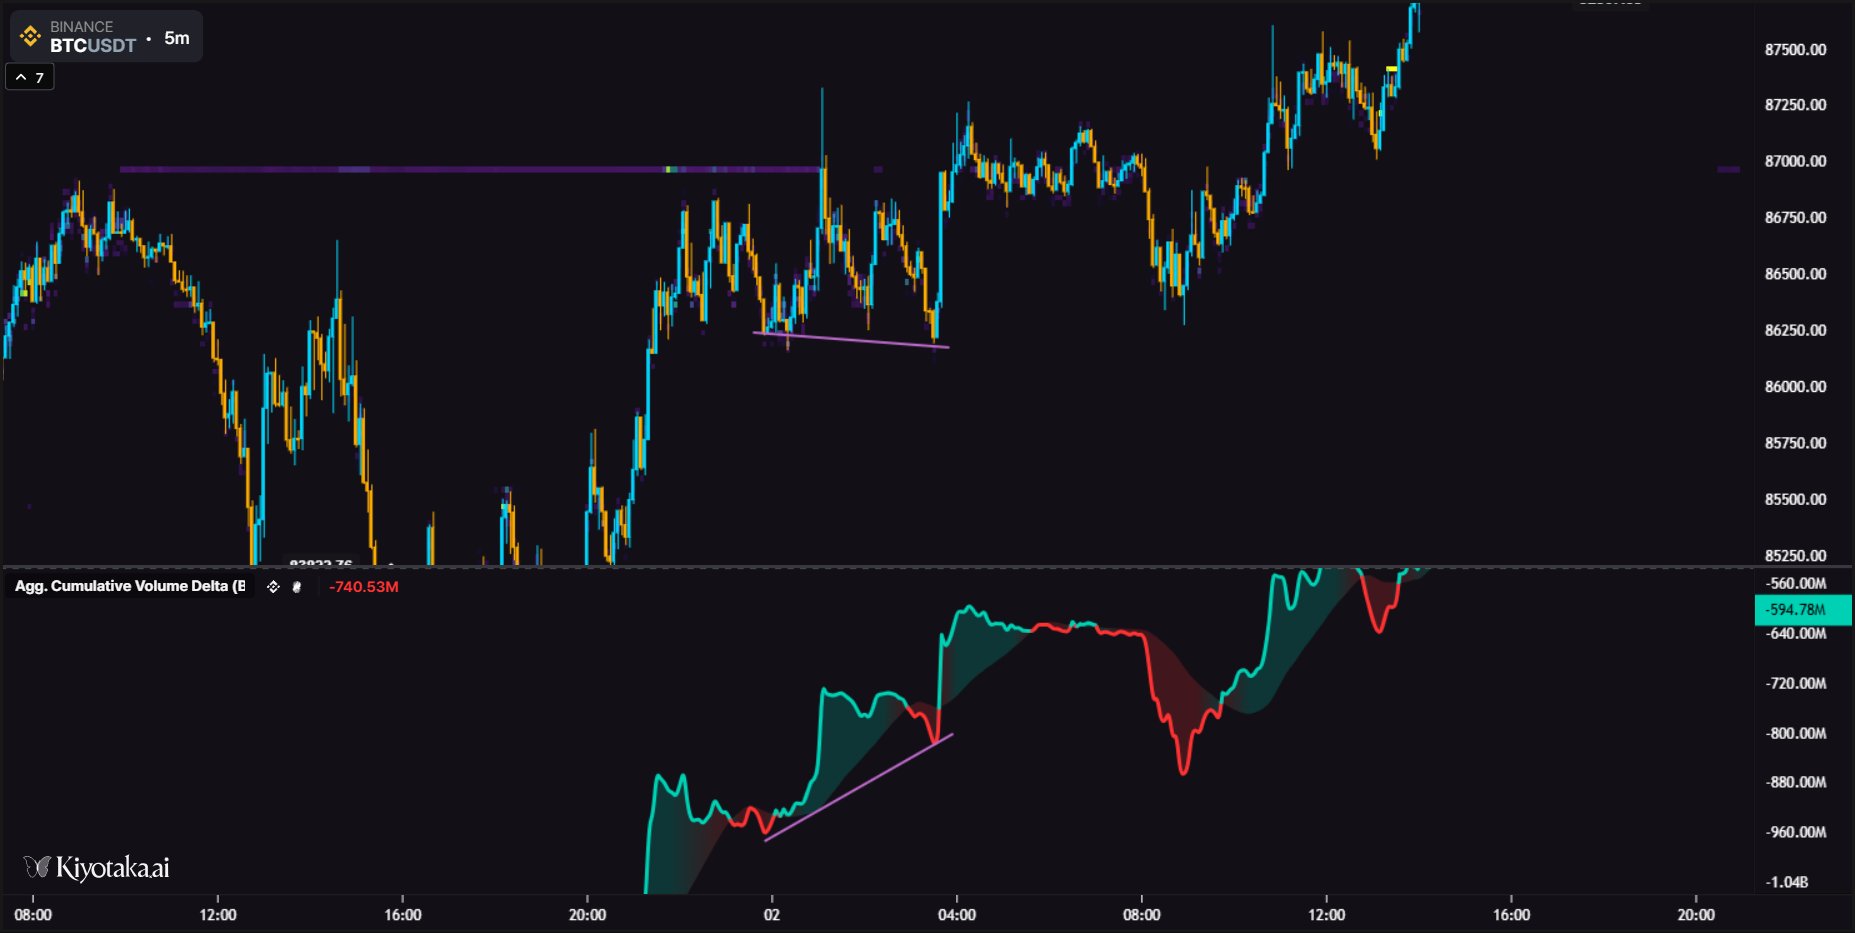
When price attempts to break, but doesn't have enough power on their side. This could be due to a heavily one-sided market, and profit taking is needed, or the aggressors are simply losing steam.
It is important to note that points of exhaustion are not often the absolute tops and bottoms, and are often revisited.
Buying Exhaustion - CVD down, price up. Indicates a lack of interest from buyers.
Selling Exhaustion - CVD up, price down. Indicates a lack of interest from sellers.
5. High Time Frame/MTF Divergences
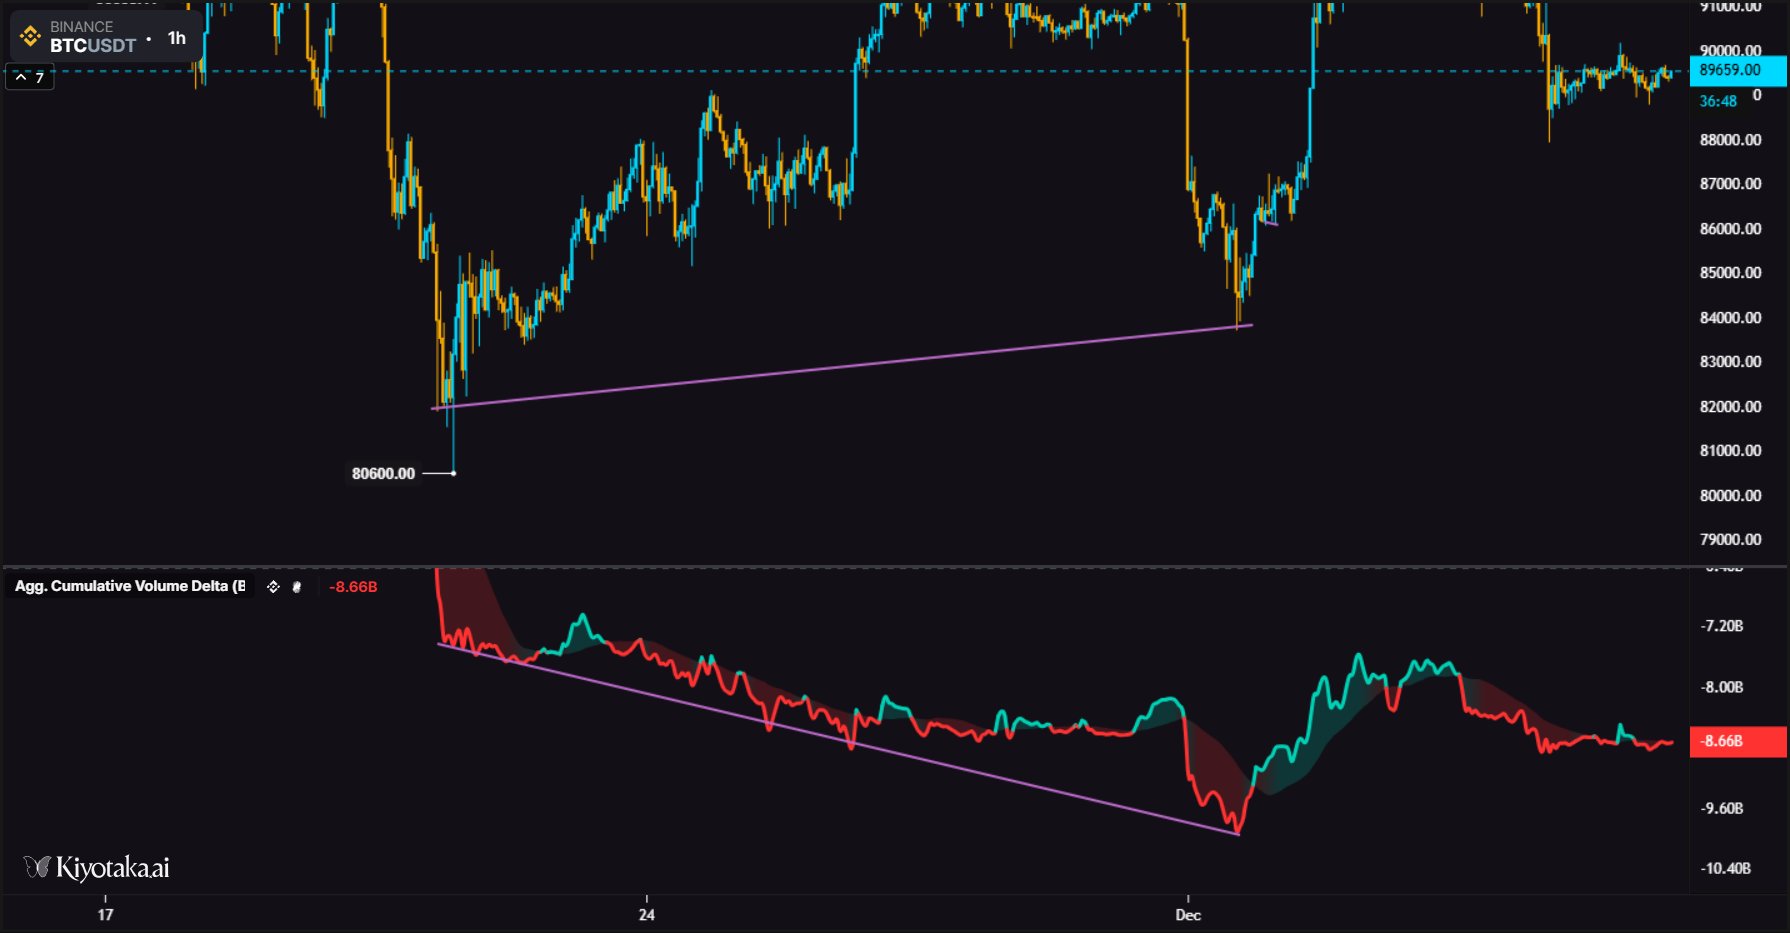
Multi session/day divergences display price building structure, yet CVD is trending in the opposite direction. This highlights large passive players accumulating or distributing over time. These are extremely powerful signs for major swing reversals. Lower timeframe CVD provides precision, higher timeframe provides structural conviction.
The most recent bottom as pictured. (Nov 21st - Nov 24th, 2025)
The role of LTF CVD (1m, 5m, 15m)
- Identify microstructure shifts
- Identify absorption within a few candles
- Confirm or validate HTF breakout attempts
- Shows delta sweeps and reactions
- Reveals trapped participants
LTF is ideal for
- Execution
- Confirmation
- Reversal timing
- Spotting traps
LTF CVD by itself is noisy and should never be used alone.
The role of HTF CVD (1H, 4H, Daily)
- Reveals multi-session accumulation/distribution
- Exposes macro divergences
- Smooths noise
HTF is ideal for
- Swing Bias
- Trend continuation spotting
- Spotting institutional accumulation/distribution
- Spotting HTF failed auctions
6. Advanced CVD Divergences
6 1.) Spot-Perp CVD Divergences
Spot indicates real demand entering the market. Real capital is required.
Spot CVD falling while Perp CVD is rising. Indicates leveraged traders are forcing price upwards, meanwhile, long term spot buyers are not supporting the move. These typically produce fake breakouts, liquidation cascades, and traps.
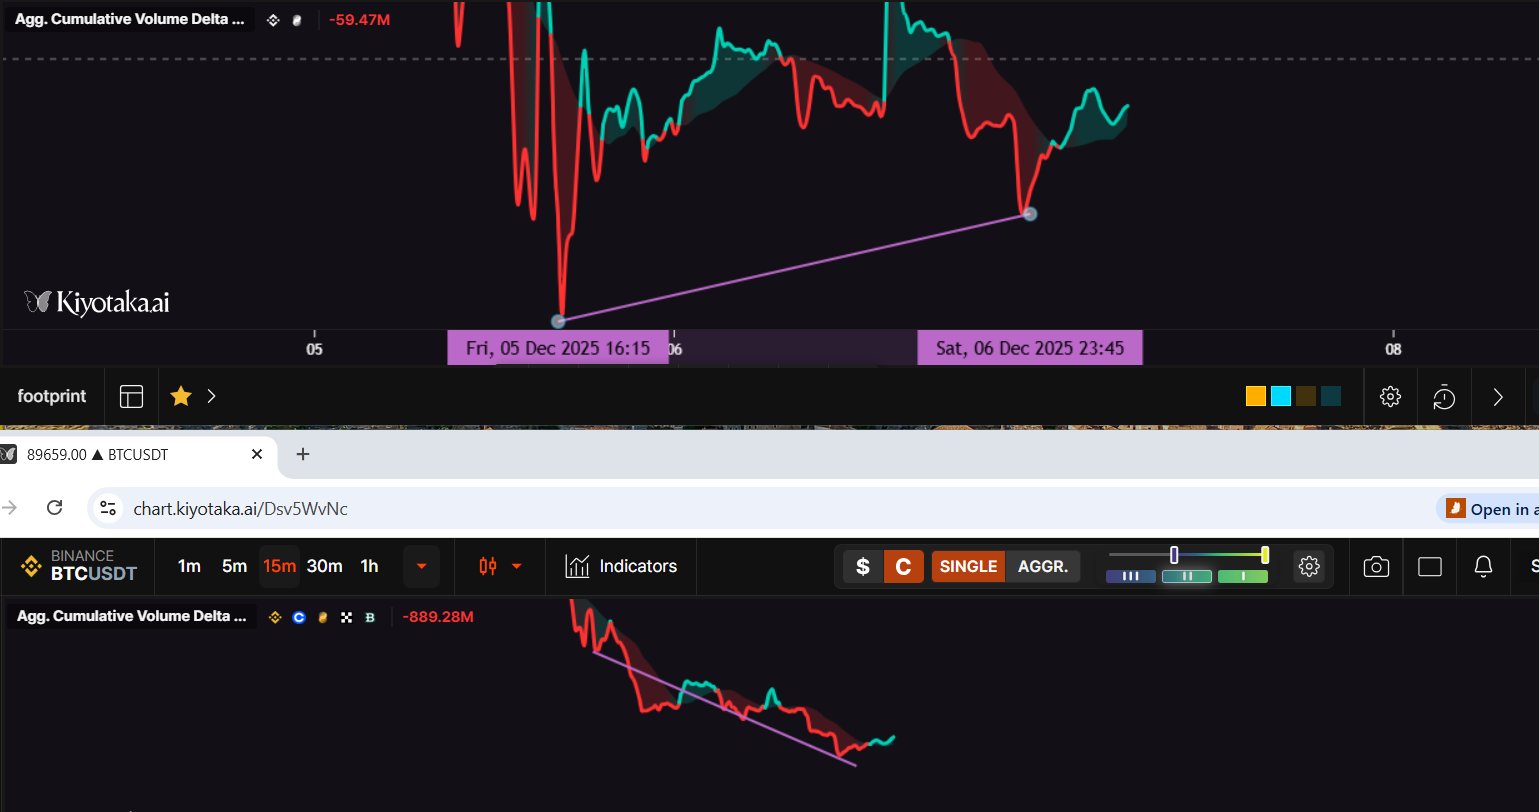
(Spot on bottom)
Meanwhile, if spot CVD is rising while perp CVD is falling, it indicates real demand entering the market, with leveraged traders not yet involved. This often precedes strong sustainable uptrends.
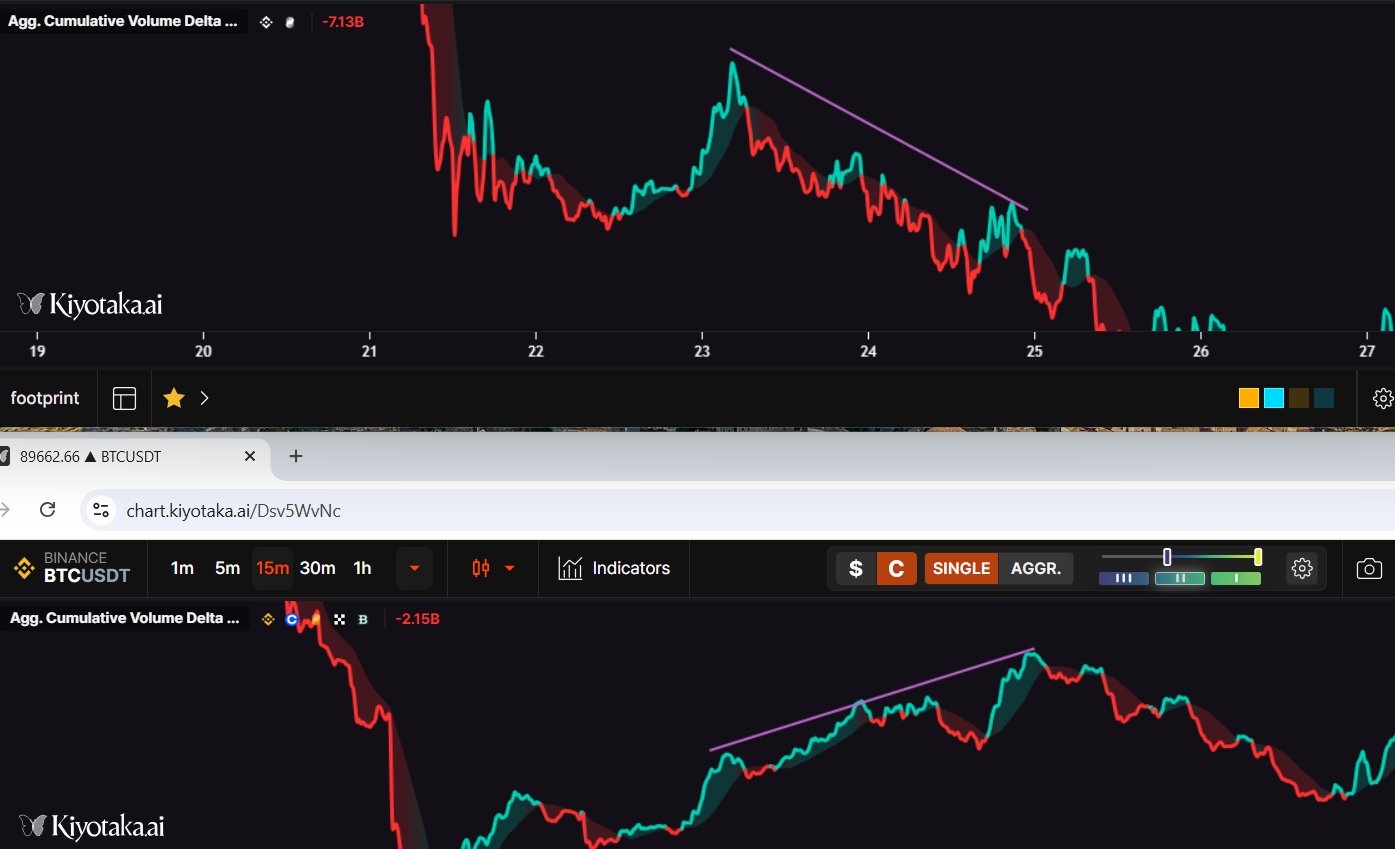
Spot CVD shows real buyers, perp shows short term and speculative.
6 2.) Exchange to Exchange Divergences
Different exchanges serve different market participants.
For example,
Binance - Leverage, retail
Coinbase - US spot flow (Heavy capital)
When Coinbase CVD diverges from Binance CVD, it indicates whether real buyers or sellers are participating.
Let's say the Coinbase CVD is rising strongly, whereas the Binance CVD is sitting flat. This suggests capital inflow from higher capitalized, sophisticated players.
This is a reason something like the Coinbase Premium Indicator, offered on Kiyotaka.ai ;) , can come useful.
6 3.) Delta Trap Divergence (V-Shape Reversal)
Often used in footprint and orderflow trading, this occurs when takers (market orders) aggressively lift offers or hit bids at the extremes of moves, yet price hits a wall and immediately reverses.
The CVD will often have huge volume bars, meanwhile price goes nowhere.
This indicates:
- Stacked imbalances hitting a wall of passive orders
- FOMO/Poor location of entry for aggressive traders
- Trapped traders
7. CVD behavior during "stop hunts"
When stops are triggered in a market, this forces the user to automatically close their position in the opposite direction, sometimes further pushing the market. These liquidations trigger an aggressive flood of market orders, with CVD spiking aggressively. Often followed by an immediate reversal.
The key: Distinguish force from intentional moves. CVD tells you if the move is authentic.
Real demand? CVD builds before the break.
Fake demand? CVD spikes at the break.
8. Healthy trend vs Poor trend
CVD gives you the ability to gauge whether or not a trend is strong.
In simplest terms, when CVD matches price, it is a healthy trend.
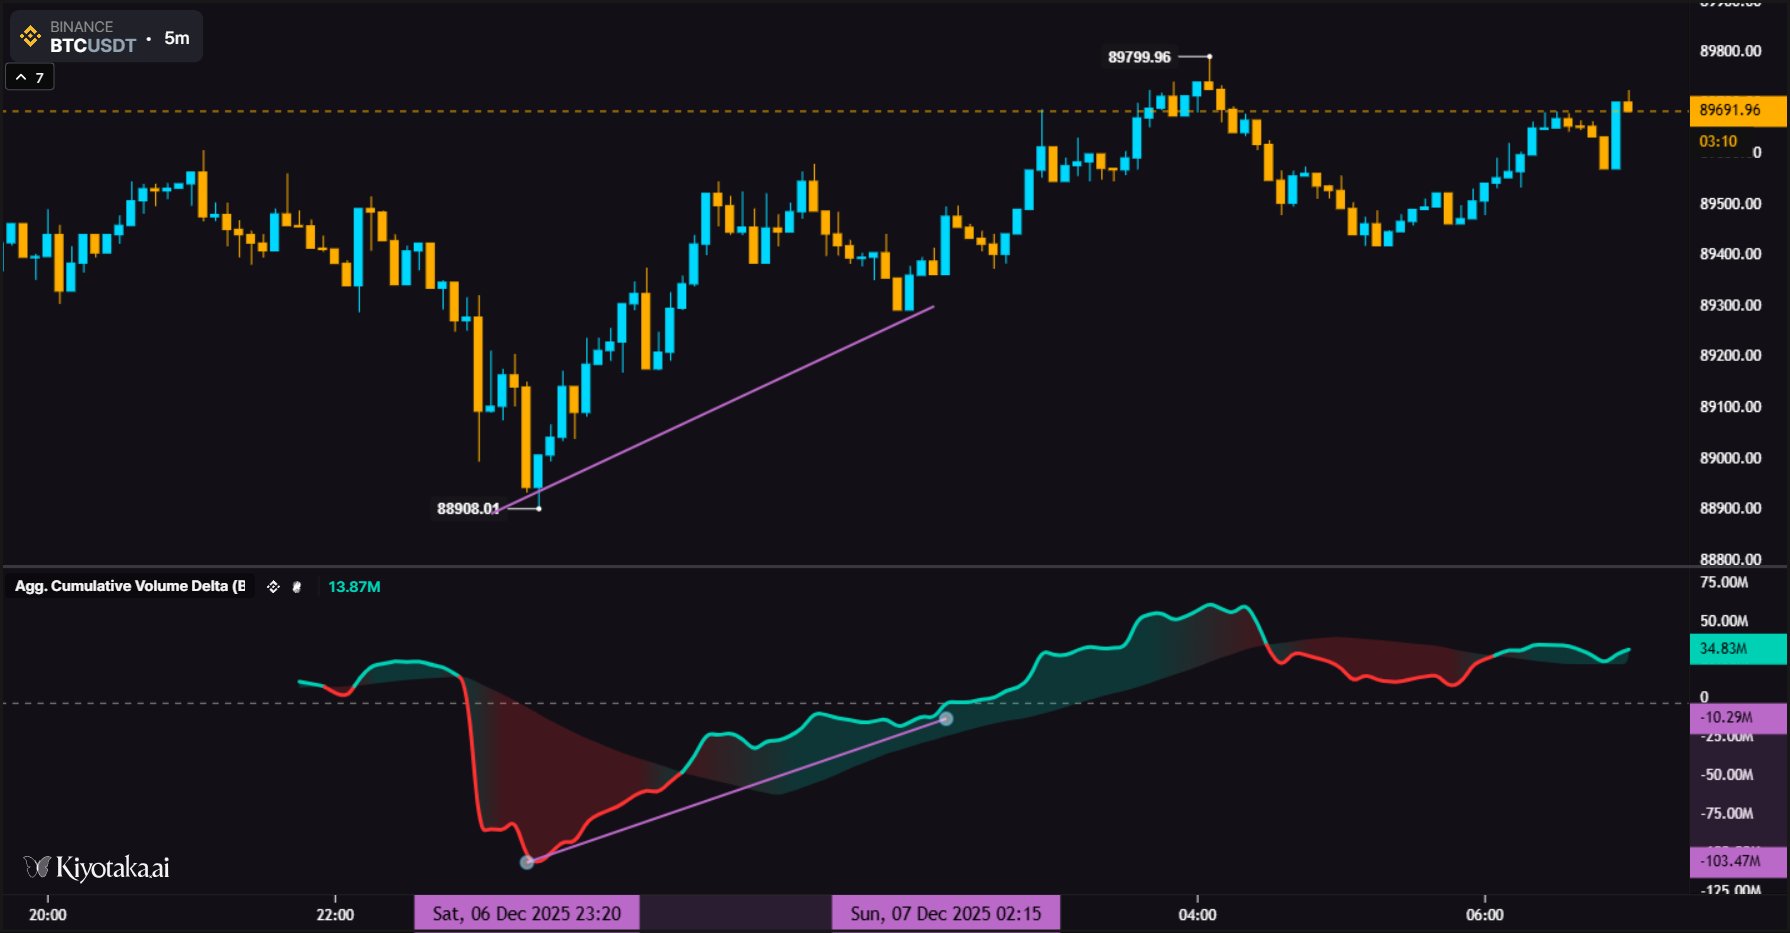
Unhealthy trend: In this case, it is also quite literally absorption, either way, definitely not a healthy uptrend. Many participants looking to sell.
9. Cumulative Volume Delta + Open Interest
CVD tells you who is aggressive, OI tells you who is getting positioned. Together, they reveal the markets inventory.
Combining CVD + OI
- OI up, CVD up = New longs entering the market
- OI up, CVD down = New shorts entering the market
- OI down, CVD down = Long Covering
- OI down, CVD up = Short covering
A real trend requires a combination of both. Rising OI, increasing CVD (in your trend direction).
This is all I have for now folks, until next time.
Sonder