HOW TO VIBECODE KSCRIPTS ON KIYOTAKA; NO PRIOR PROGRAMMING KNOWLEDGE REQUIRED, JUST AN IDEA IS SUFFICIENT
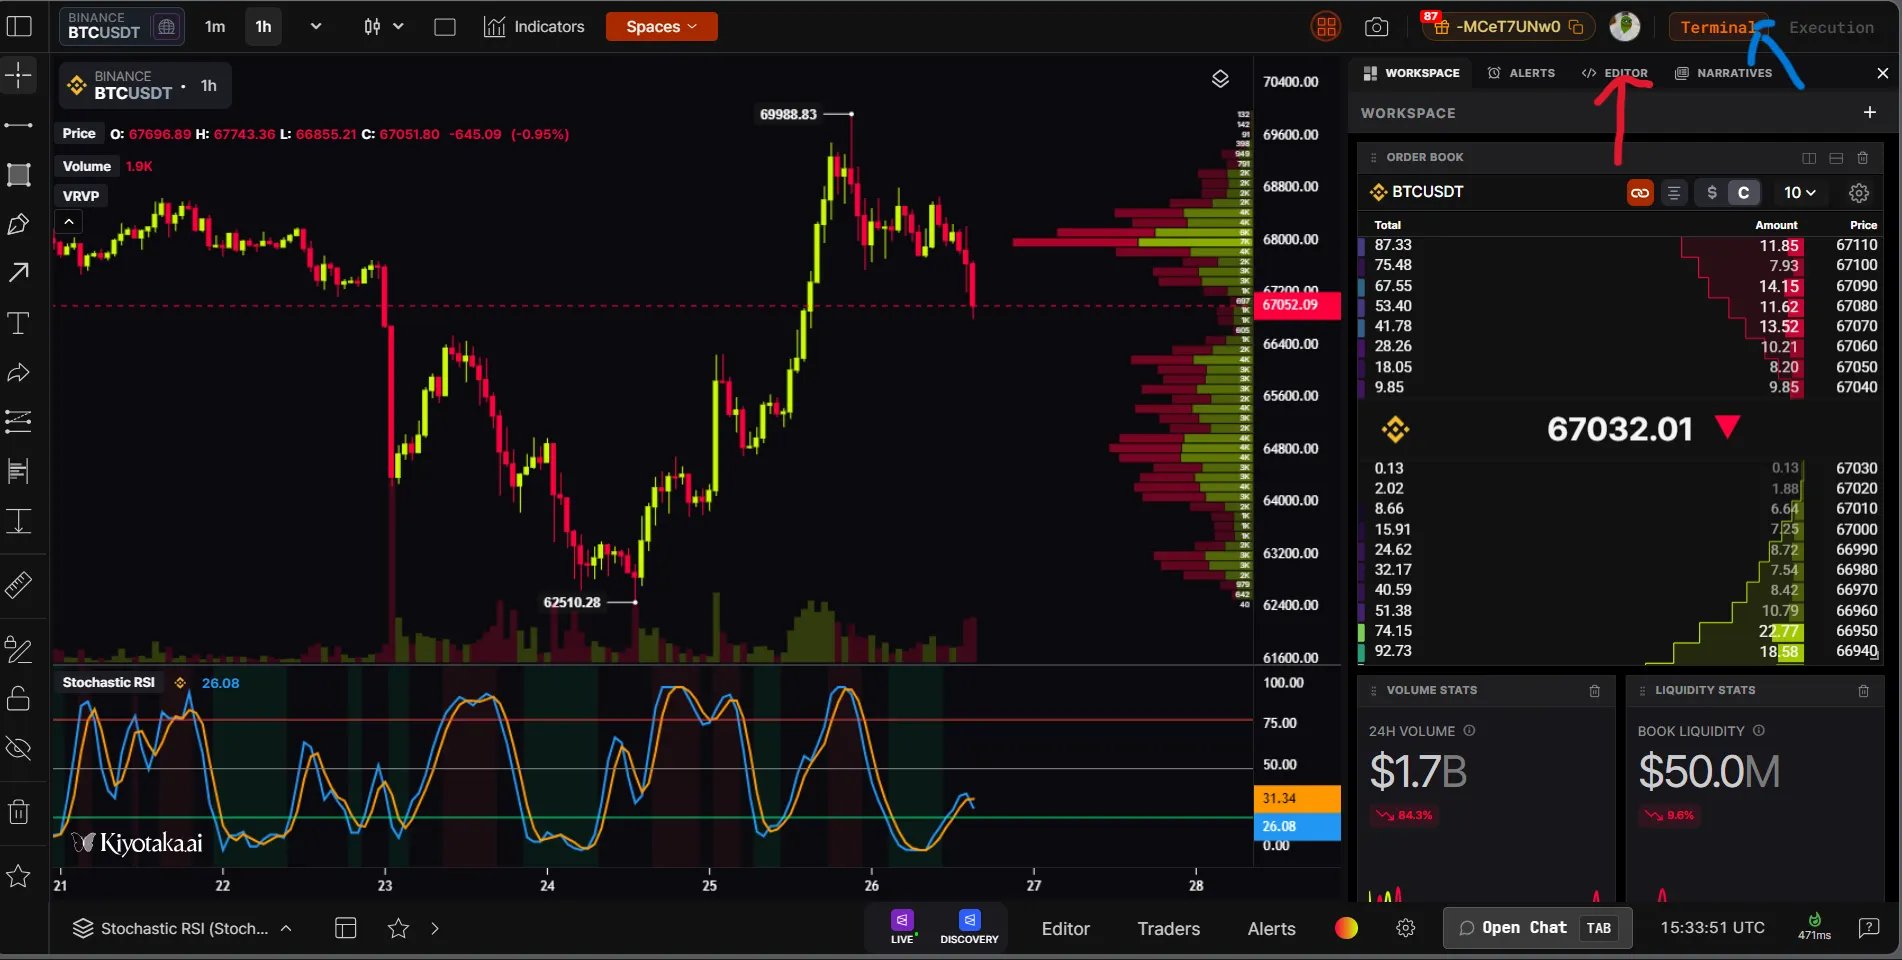
**STEP BY STEP:**1. click on terminal(blue arrow) located at the top right corner of your dashboard, the click on Editor(red arrow).
Press enter or click to view image in full size
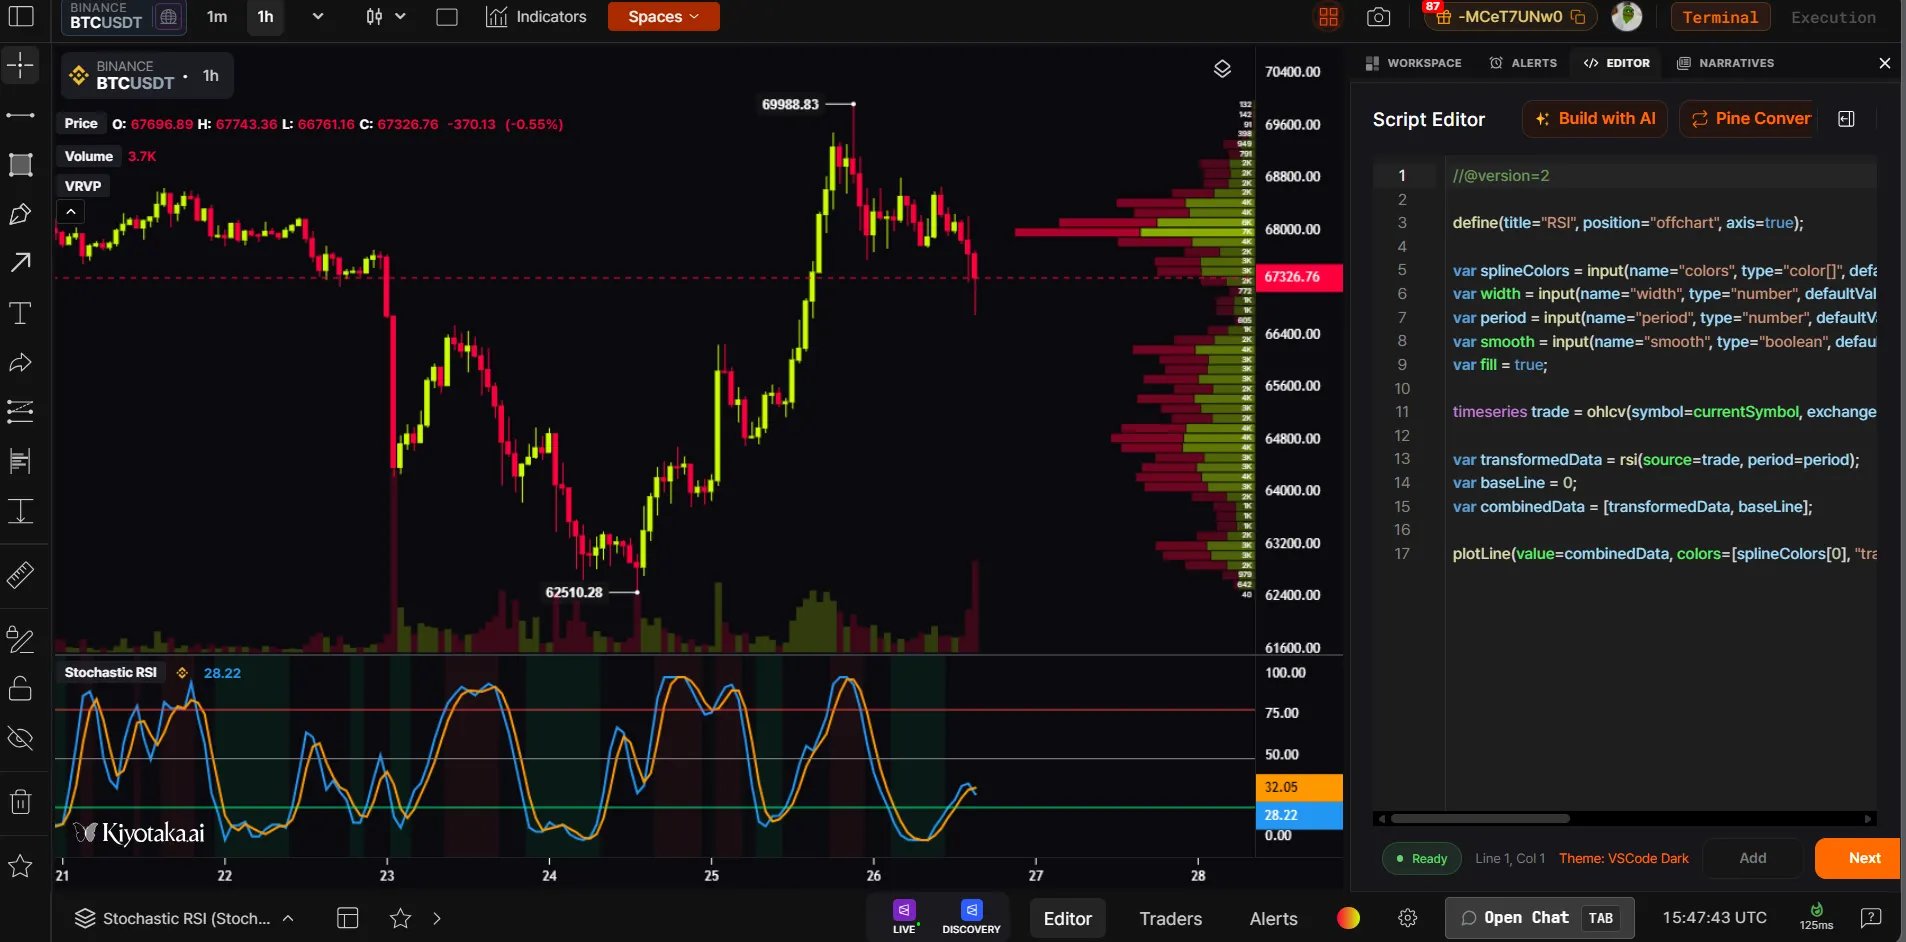
You will see a script editor with a sample code already there, we will use it as a debugging too if we run into some syntax errors later
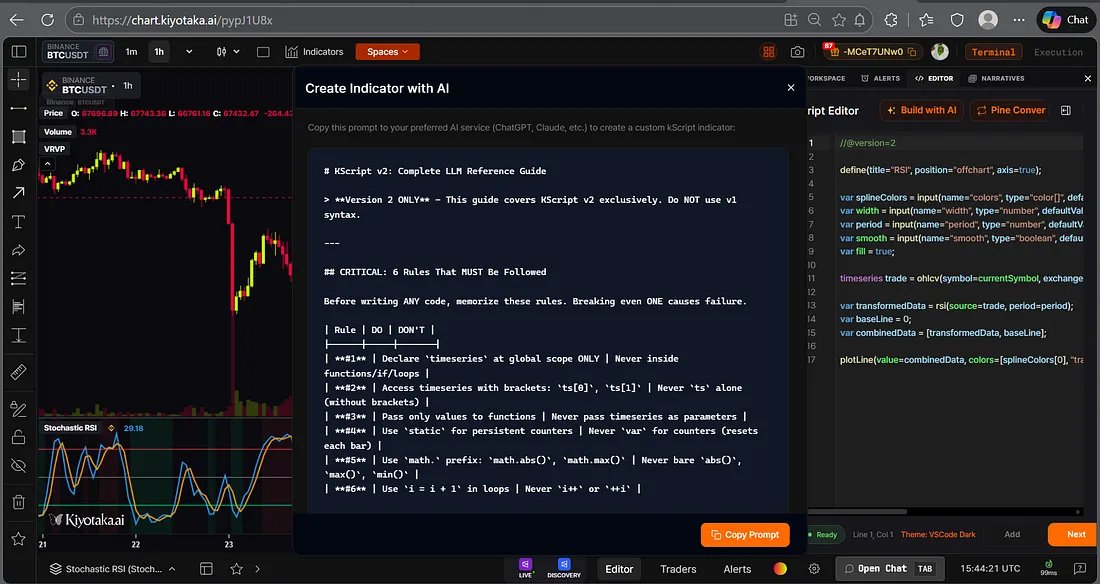
- click on build with AI button located on the top of the script editor, you will see an already made prompt by the kiyotaka team, copy the prompt and headover(with the idea of the indicator in mind)to your prefered AI (claude recommaded)
Press enter or click to view image in full size
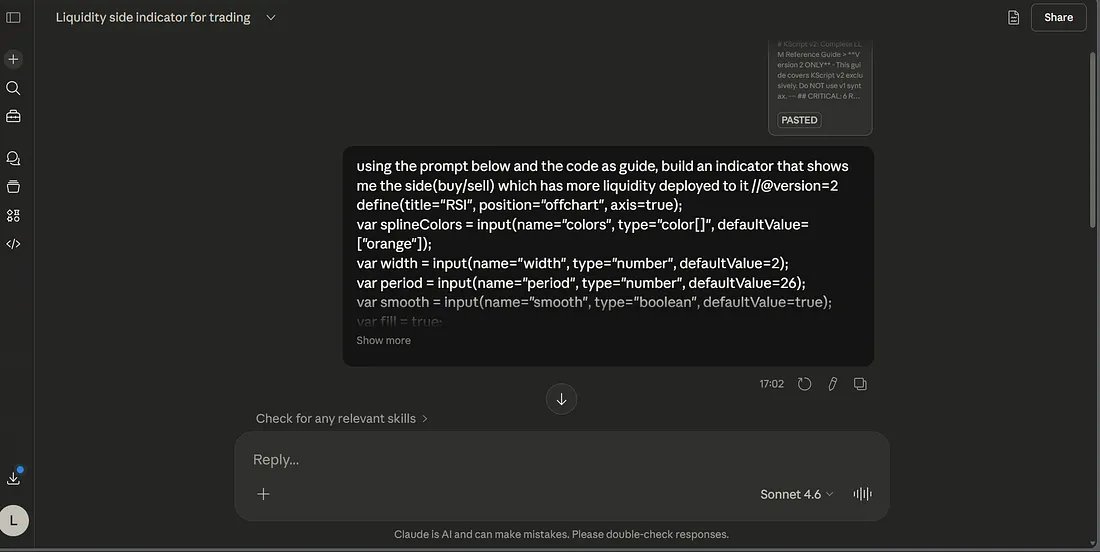
- For me, I want to build an indicator that shows me the side (buy/sell) which has more liquidity deployed to it (the ai should understand hehehe), so I will prompt it like this(for safety, I’d advice you also include the original code you saw during the prompting to avoid future syntax erros:
using the prompt below and the code as guide, build an indicator that shows me the side(buy/sell) which has more liquidity deployed to it [insert prompt here] [code here]
Press enter or click to view image in full size
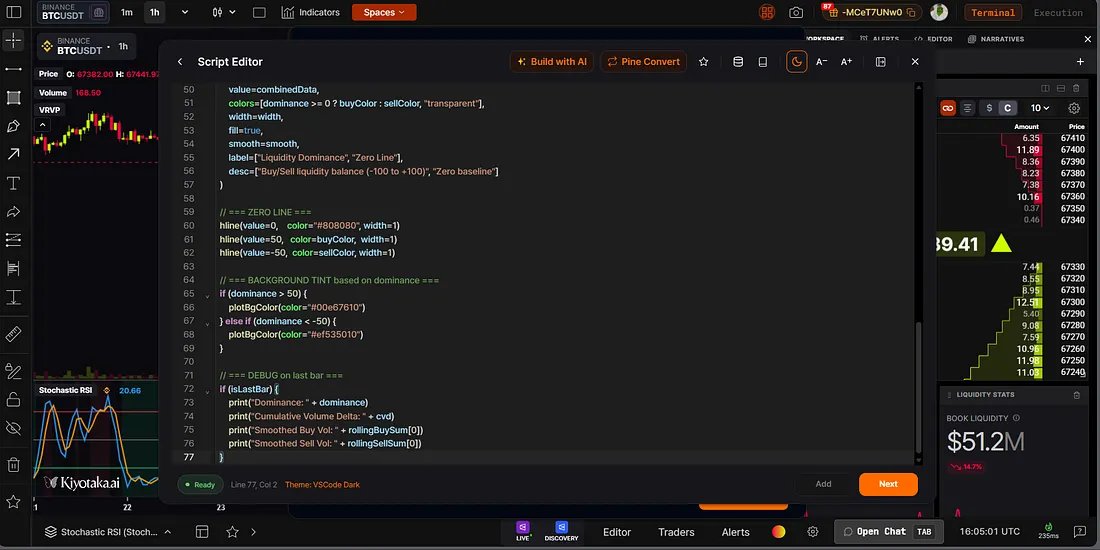
- After you must’ve gotten your code from your AI, proceed to kiyotaka site , delete the original code and paste yours there, and then click on next , you can click on add if you want it to be added to your chart immedietly. It is advice you click next and save it first
Press enter or click to view image in full size
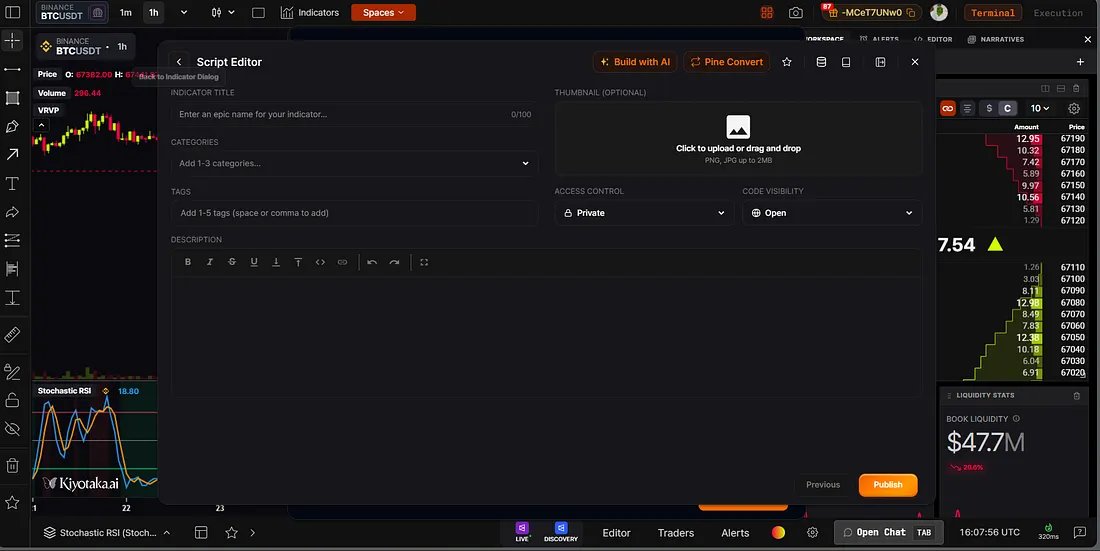
- After you click on next, you will be provided a page to fill the details o your indicator such as title, descriptions, wether or not you want your code to be private, wether or not you want your chart to be private, thumbnail etc, fil them all and click on publish
Press enter or click to view image in full size
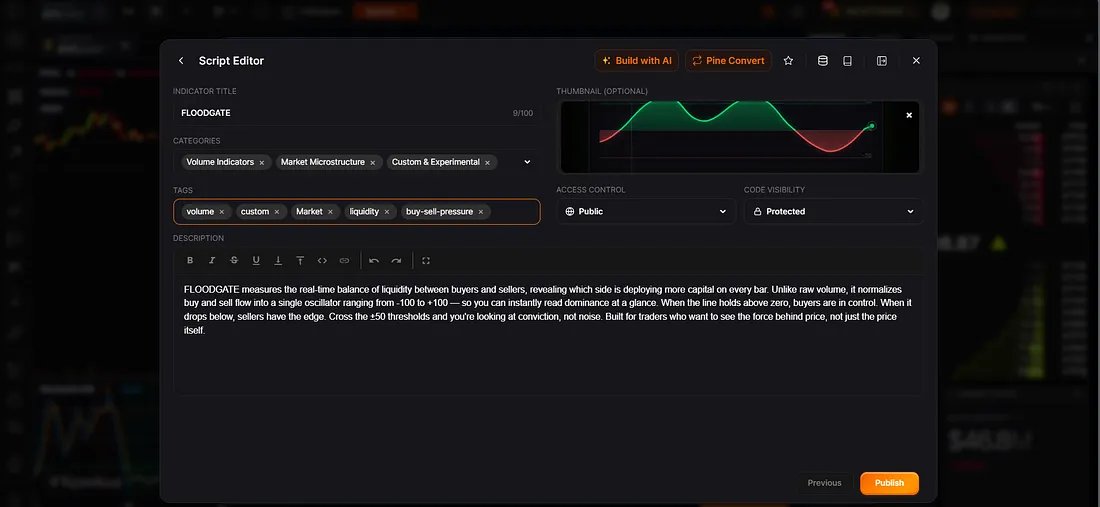
- To view your published indicator, go to indicators on your dashboard and click on scripts, from there, you can add them to your charts…good luck!
Press enter or click to view image in full size
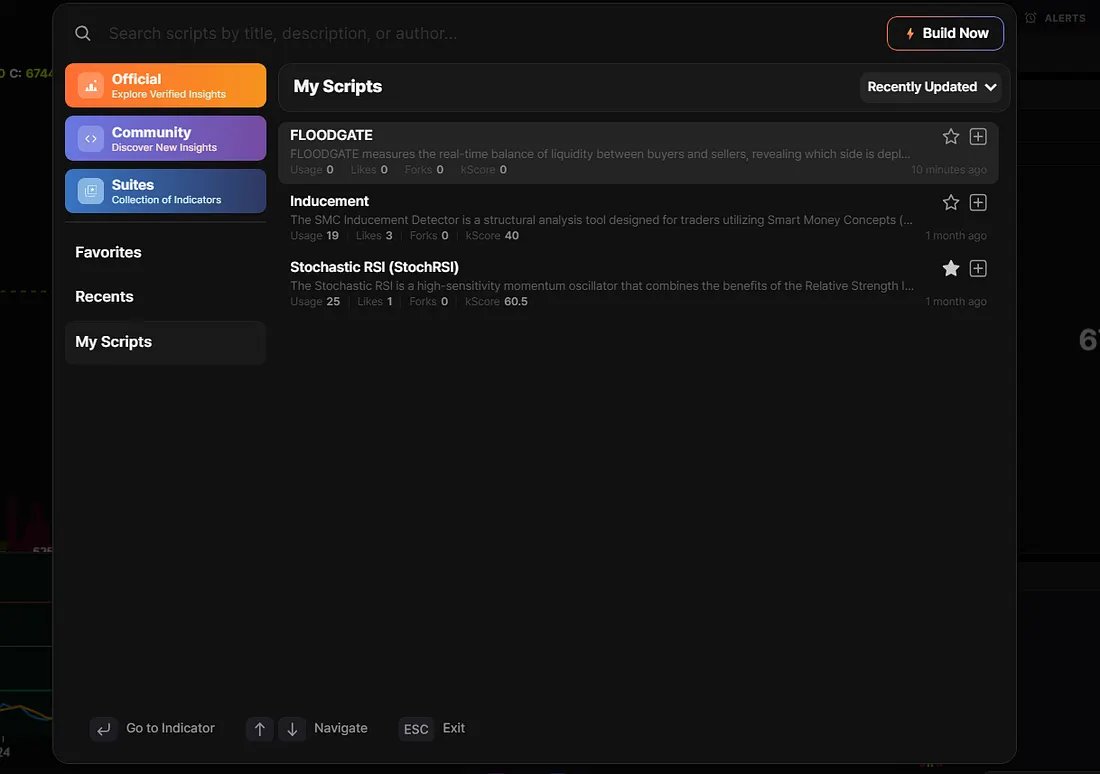
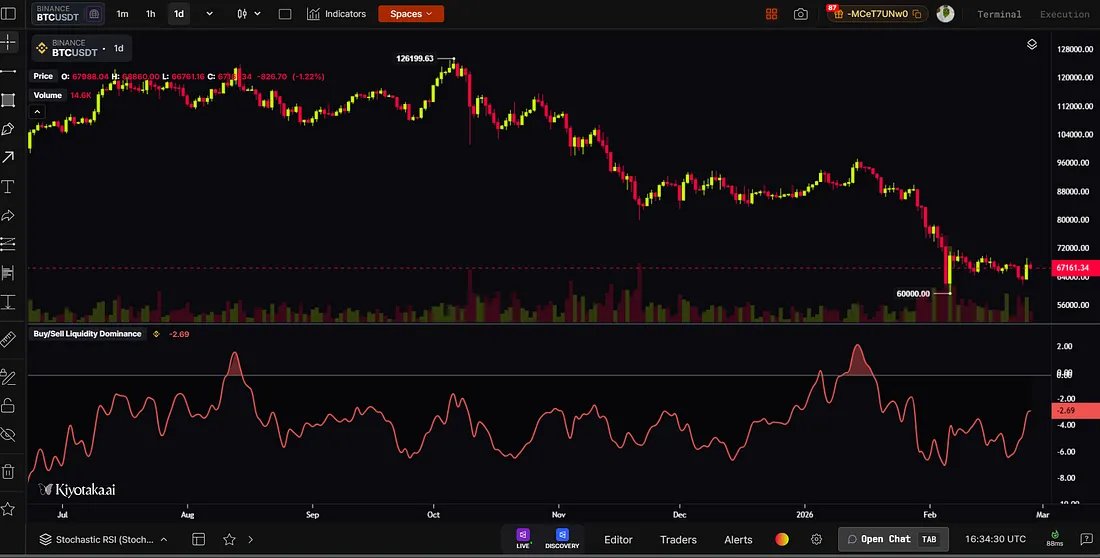
The indicator fully working in the above image
**What you’re seeing:**The line is currently at -2.69, sitting in negative territory, which means sellers have been deploying more liquidity than buyers over the smoothing period. You can see this lines up perfectly with the price action BTC has been grinding down from ~$126K all the way to the current ~$67K range, and FLOODGATE was reflecting sell-side dominance throughout that decline.
The two notable spikes upward (around August and November/January) are moments where buy-side liquidity surged aggressively both align with relief rallies on the price chart before sellers reasserted control and pushed the line back down.
The fact that the indicator is still negative heading into March tells you the structural sell pressure hasn’t flipped yet buyers haven’t shown up with enough conviction to push dominance into positive territory and hold it. That would be the signal to watch for.
Congratulations for building your first indicator on kiyotaka AI
If you have any issues, don’t hesistate to contact me on x : x.com/laegend