Market Profile Series #2
0. Foreword
In this article I try to get into some basic understanding of auctions, and with that foundation we can try to understand some basic Initial Balance (IB) patterns, extremely useful for day trading.
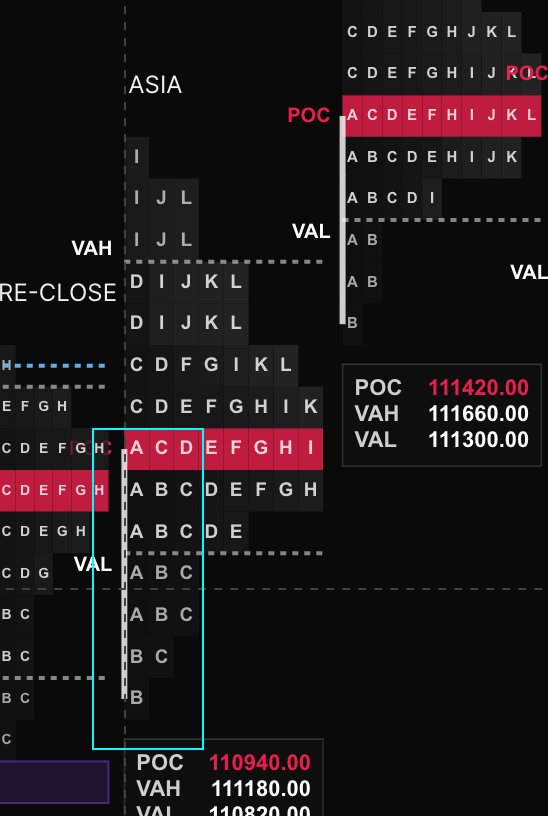
Simply put, the initial balance is the price range during the first two periods (A and B).
Why do I mention day trading? Because I think it's the timeframe where market profile shines more brightly. And when you're speculating on projections, it's much easier to be right in the short term than in the medium and long term. There is a lot of noise on CT, with bullish and bearish takes all over the place.
You can largely ignore them when you're day trading. I'm not saying we should ignore large trends, but rather that we should separate from the "bull" and "bear" narratives. They prey on one of the weak points of the human mind: validation of bias.
The bigger your desires, the bigger the need for validation. Once you separate from this and you realize you only need to be right on a small (e.g., short-term) bias, you can start to breathe with the market. You're not here to wish or hope. You have to become one with it.
You're here to read what's going on, understand what's the most likely move, and position accordingly as early as reasonably possible. Ideally, you also want to get out as early as possible once your target has been hit. If you predict a 2% move in your favor on a trade and you reach that spot, get out or scale down.
Don't get back in if it keeps going. It's beyond what you predicted and most likely for a reason. The market will still be there tomorrow. And if you avoid risky moves, your money will be there tomorrow, too.
1. A bit of context.
To fully understand market profile trading, you need to internalize three points:
Price is an advertising mechanism for opportunity,
Time regulates each opportunity,
Volume measures the degree of success of each auction.
Price and volume tell us who's willing or unwilling to give up their goods at a certain value. The majority will trade close to the same value, while a minority will be inclined to trade as far as possible from what the majority perceives as fair value.
But what is fair value?
Fair value is consensus-based, and from a day-trading perspective, it's easy to identify: it's the price at which most of the trades took place - often within the VA (70% of trades), and more specifically, the POC.
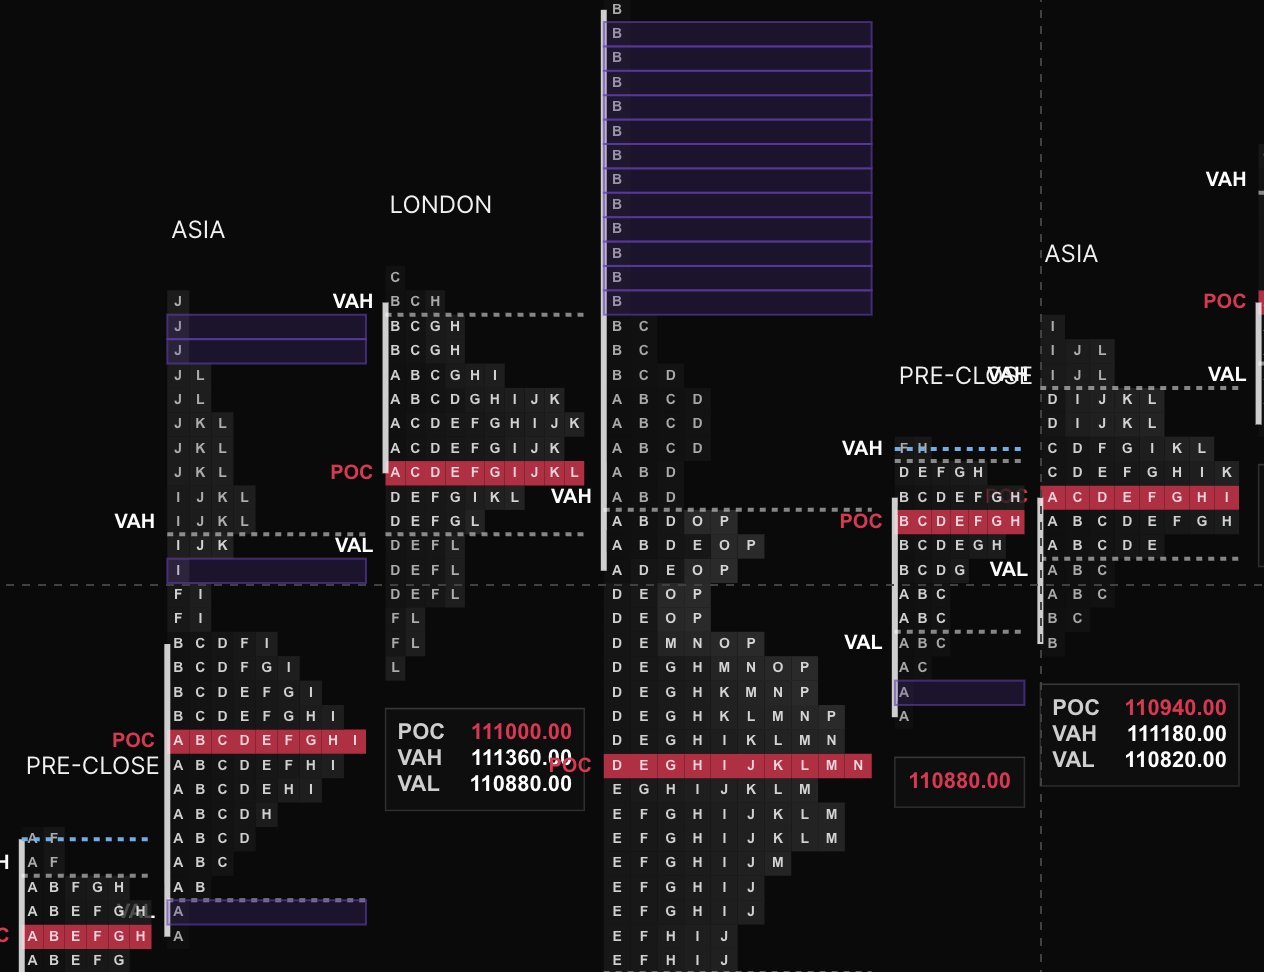
POCs are highlighted with a red band.
The POC is automatically generated in any serious market profile tool available.
If you want to access free market profile charts, try @kiyotaka_ai
. It's neat, fully customizable, and free to use.
Whenever the price shifts from the fair value/POC, we have the conditions for an auction to start.
Bulls and bears enter the pit, and volume (bidding activity) will determine if a divergence from the fair value (above or below) is sustainable.
If we see enough volume on these attempts, it means players are reassessing their idea of fair value.
If the volume does not react to the auction, participants are uninterested, and the price quickly reverts to the mean.
Reversion to the mean (or mean reversion) is the idea that prices tend to move back toward their average or "fair value" over time after deviating too far. In market profile terms, if price spikes away from the POC or value area without strong volume support, it's like an overextended auction: buyers or sellers lose interest - "this stuff is getting too expensive, I'm not buying it" - and the market pulls back to where most participants agree on value, creating opportunities for fade trades or rotations.
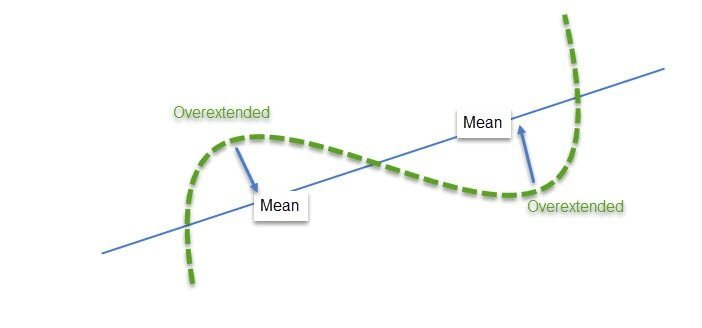
A chart depicting mean reversion.
For people who need to visualize things: watch the following videos if you want a visual, tangible representation of these principles:
https://www.youtube.com/shorts/_zBIciWB0tw
Sometimes, participants will want to pay less before they're ready to pay the originally advertised price. Other times, the first bidders will take the advertised price at face value, and other participants on the sidelines will be willing to pay more right away. They fear the fair value is much higher, so they rush to place their bids, driving the price up.
This thing happens millions of times a day in the market. You just need to listen to it.
2. Pattern recognition
If you see the market as the auctioneer, and the traders as the participants, all should start making sense.
This happens regularly, and our monkey brain can identify recurring patterns.
Below I highlight and explain the most recurring ones.
Before you rush to overlap these patterns to your charts to find the next big move, please remember that they are useful to the extent that they are used and contextualized in broader market conditions.
I screen captured these on the last 2 months of the
chart - and trust me, these are the clearest I found. The following images are as close as the ideal types of patterns you can find out there.
The market is seldom this clear.
But with a bit of practice, you will understand what's going on early in the session.
Also, please note that these patterns can go both ways, up or down.
3. The four openings.
The four openings refer to some recurring patterns that may form during the IB and right after it. They are sorted in order of conviction, from highest to lowest.
Open, drive
This opening is characterized by an auction right out of the gate. Any retrace is short-lived, and it lasts as long as the buyers or sellers are in control.
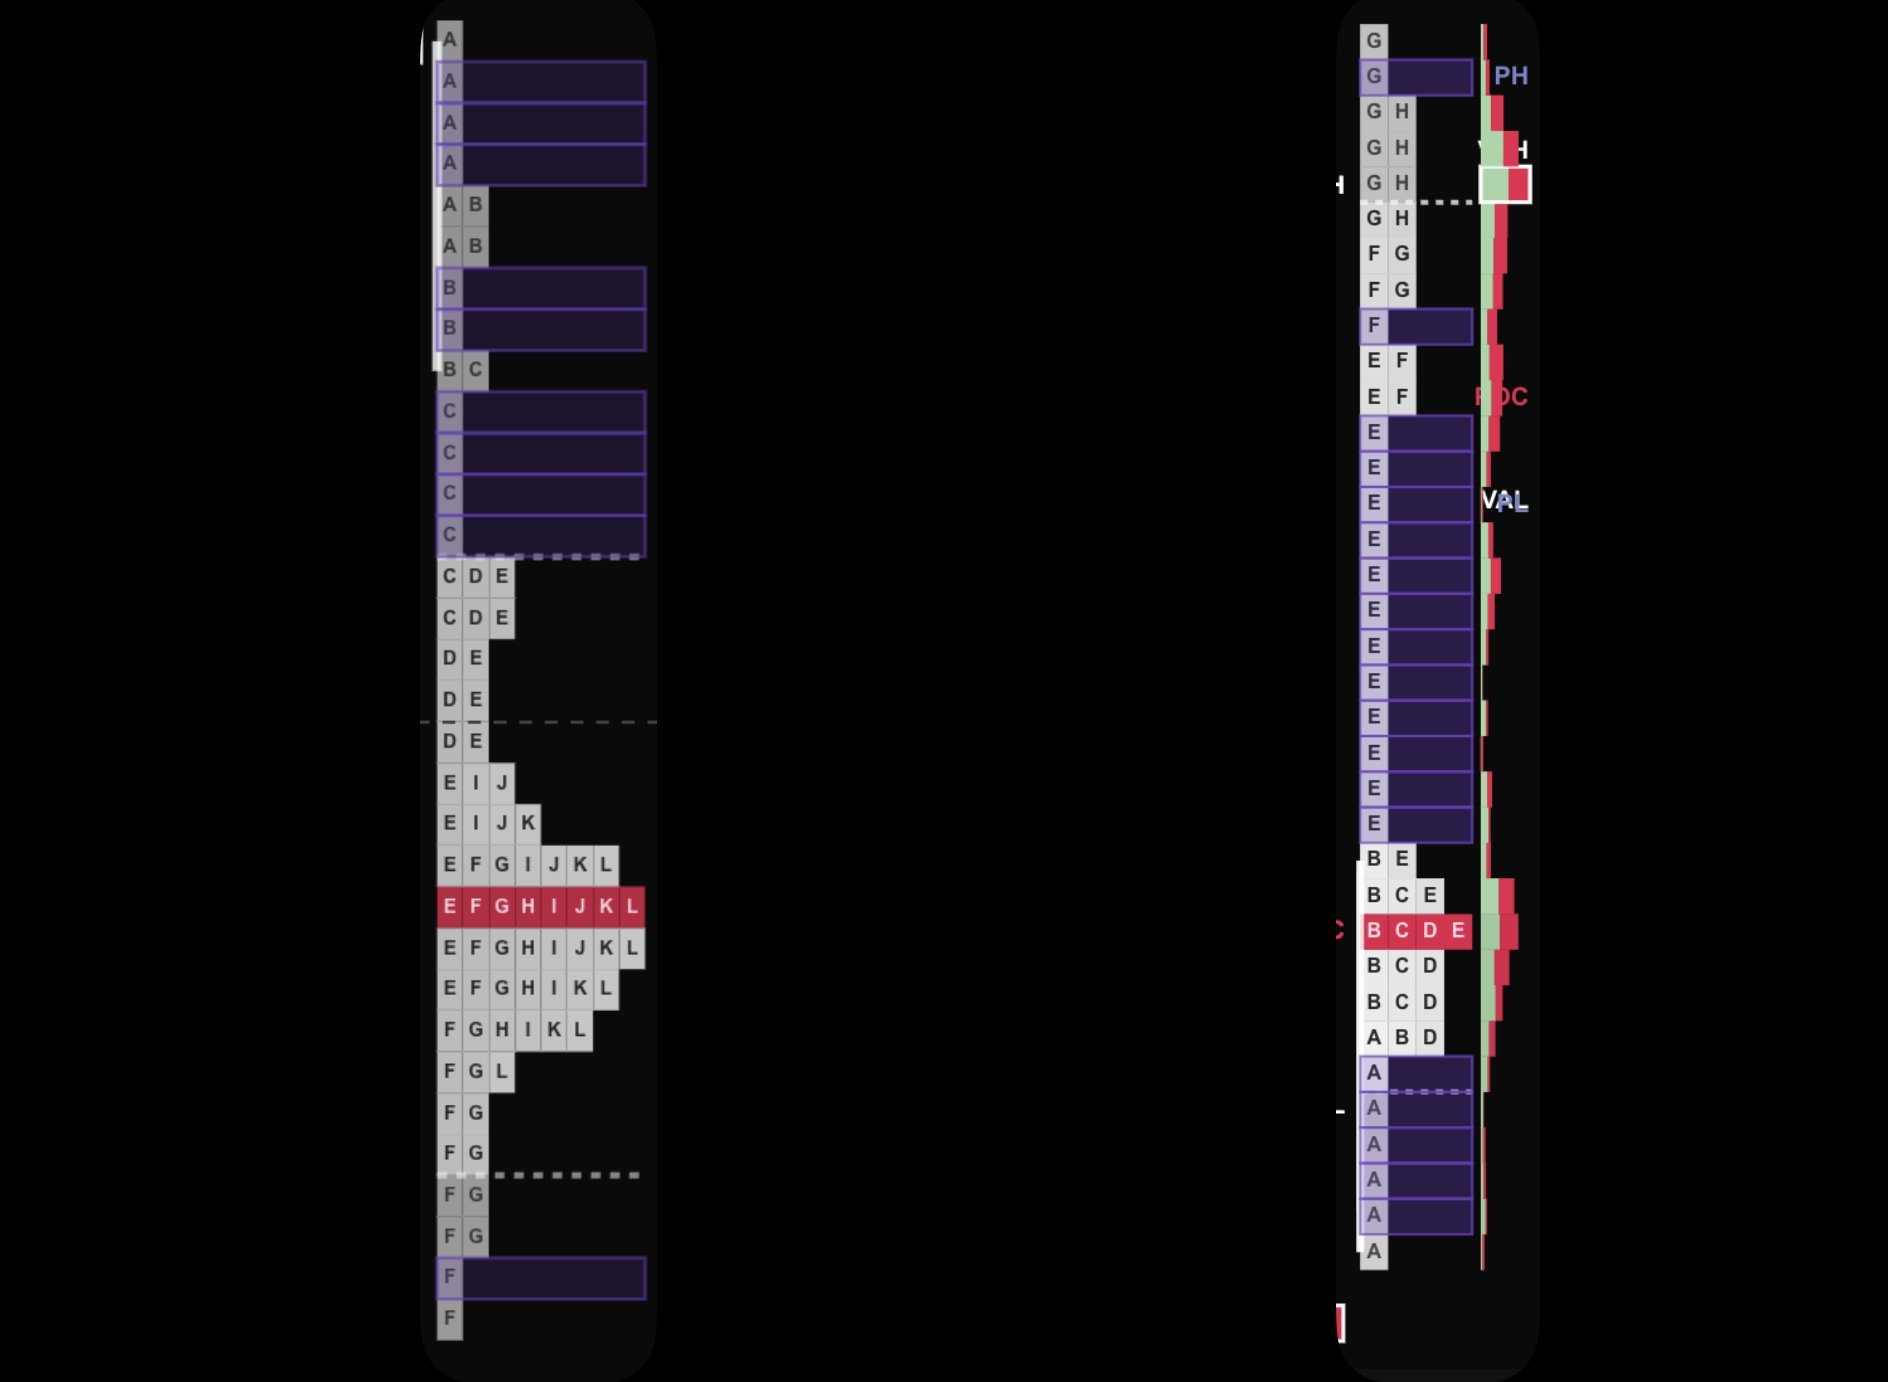
Two Open, drive days, downward and upward.
The auctioneer advertises the opening price, and participants rush in to place their bids.
Did you see the first video I linked above?
"Opening bid is 2.5 million, do I have 2.5?"
"2.5 on the opening offer!"
"2.55"
"Do I have 2.60?"
"2.65"
And so on.
This is a trend day. DO. NOT. FADE.
Open, test, drive
This play shows a lower conviction, and participants try to drive the price in a certain direction to see if any business can be done there, before quickly turning the opposite direction for a rally.
The price quickly sets the high or low for the session, then reverses course quickly and runs all the way through the opposite end of the IB. Usually the print is thin, so the price fluctuation is rapid.
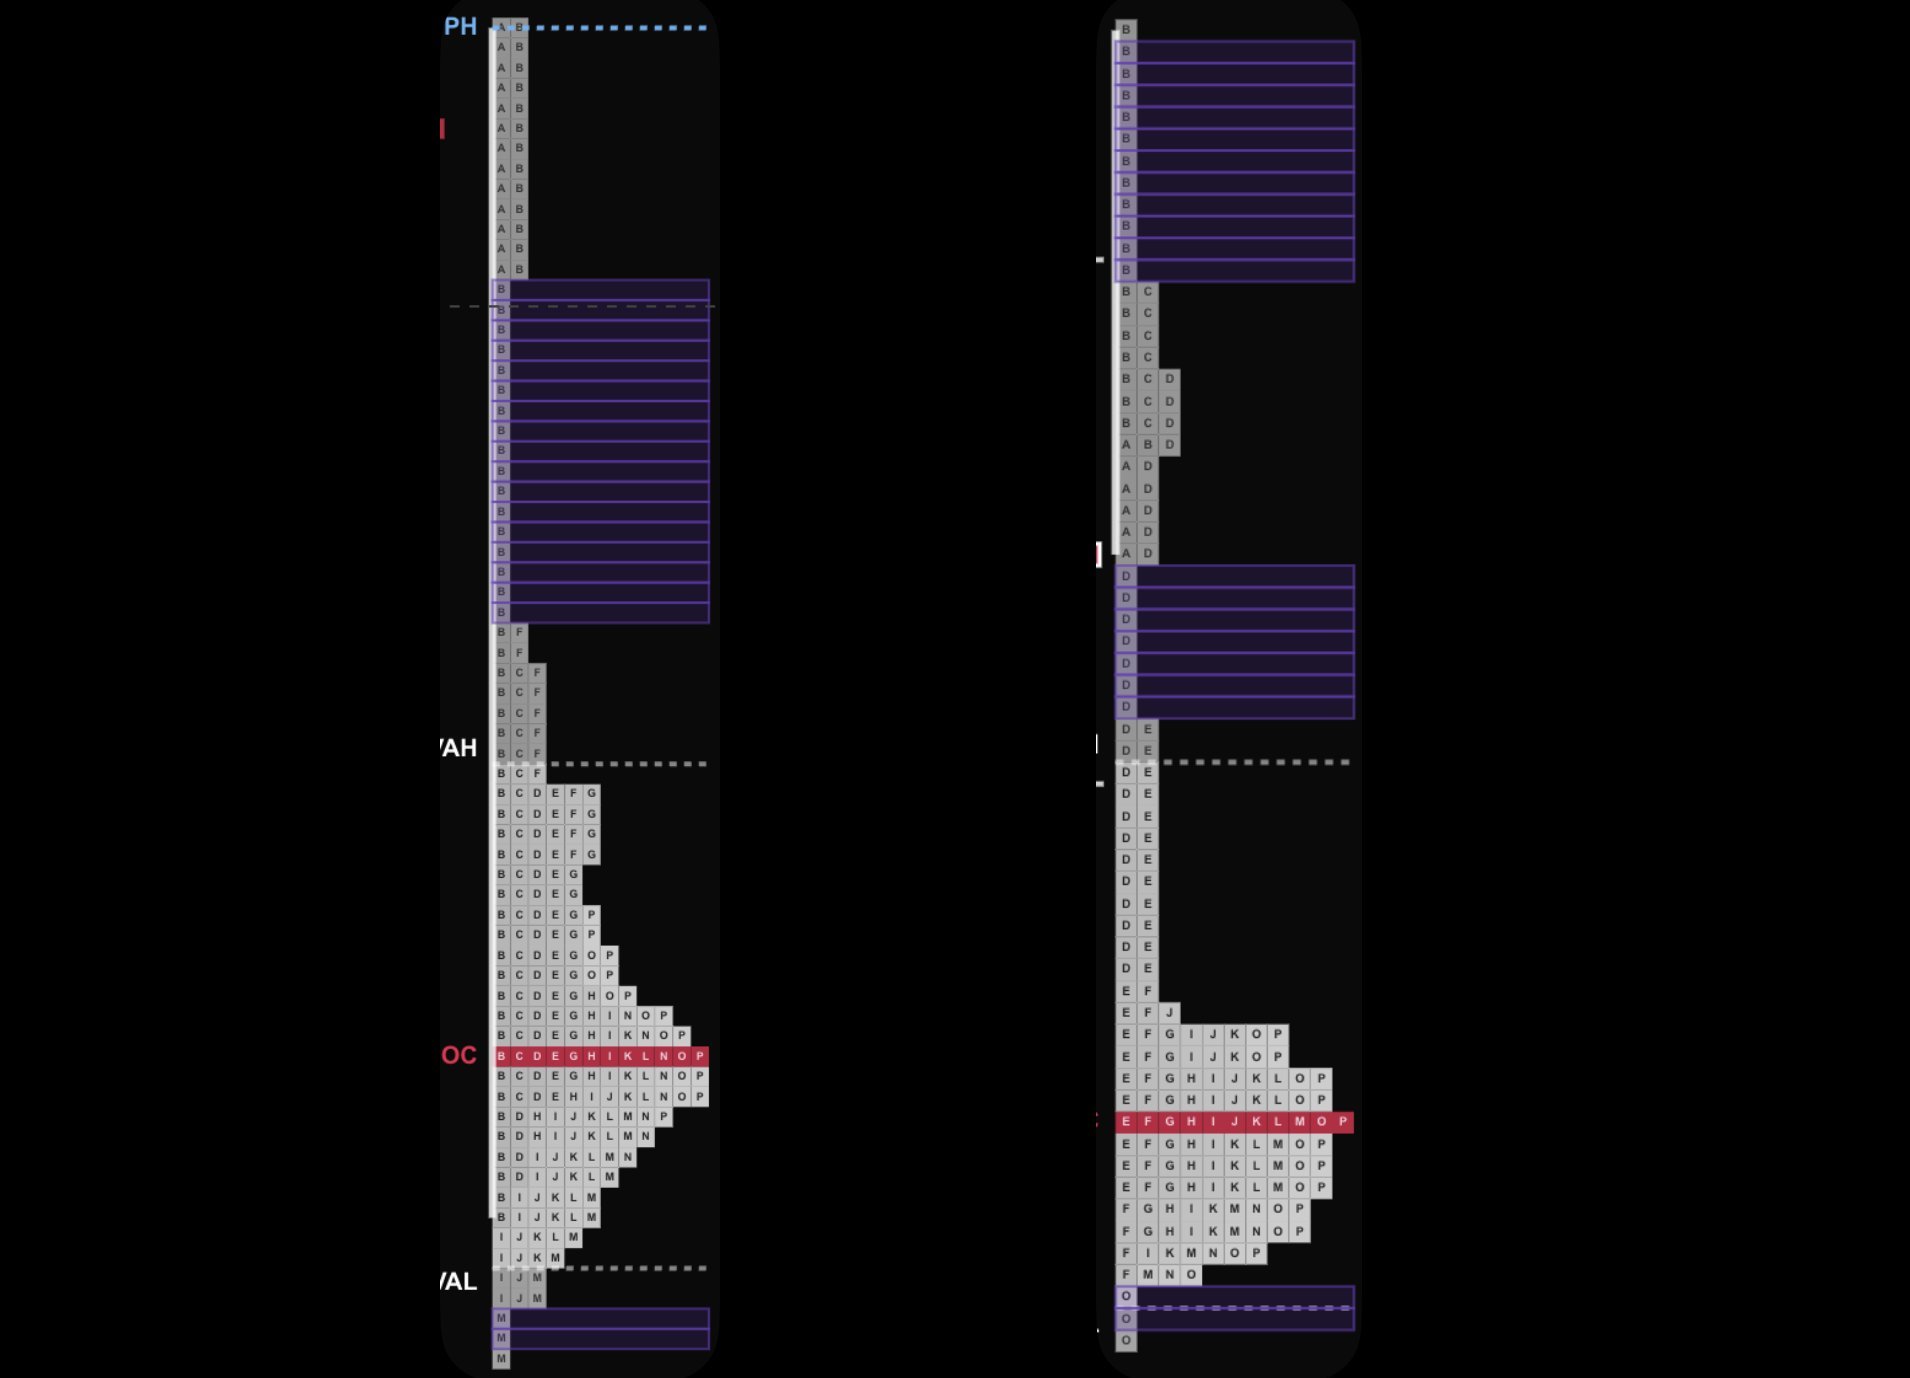
Two downwards day with an Open, Test, Drive pattern
Have a look at the second video?
"400k anywhere?"
The gentleman in the first row goes "100 grand", and the auction quickly starts.
"100 and a quarter"
"150"
"170"
"200 anywhere?"
And so on.
Again, the trend is clear, so do not try to fade this. Trade with the market direction.
Open, rejection, reverse
When I first saw an Open, rejection, reverse pattern, I couldn't wrap my head around it. It looks very similar to Open, test, drive after all.
But with time, I understood that the difference lies in the nuance.
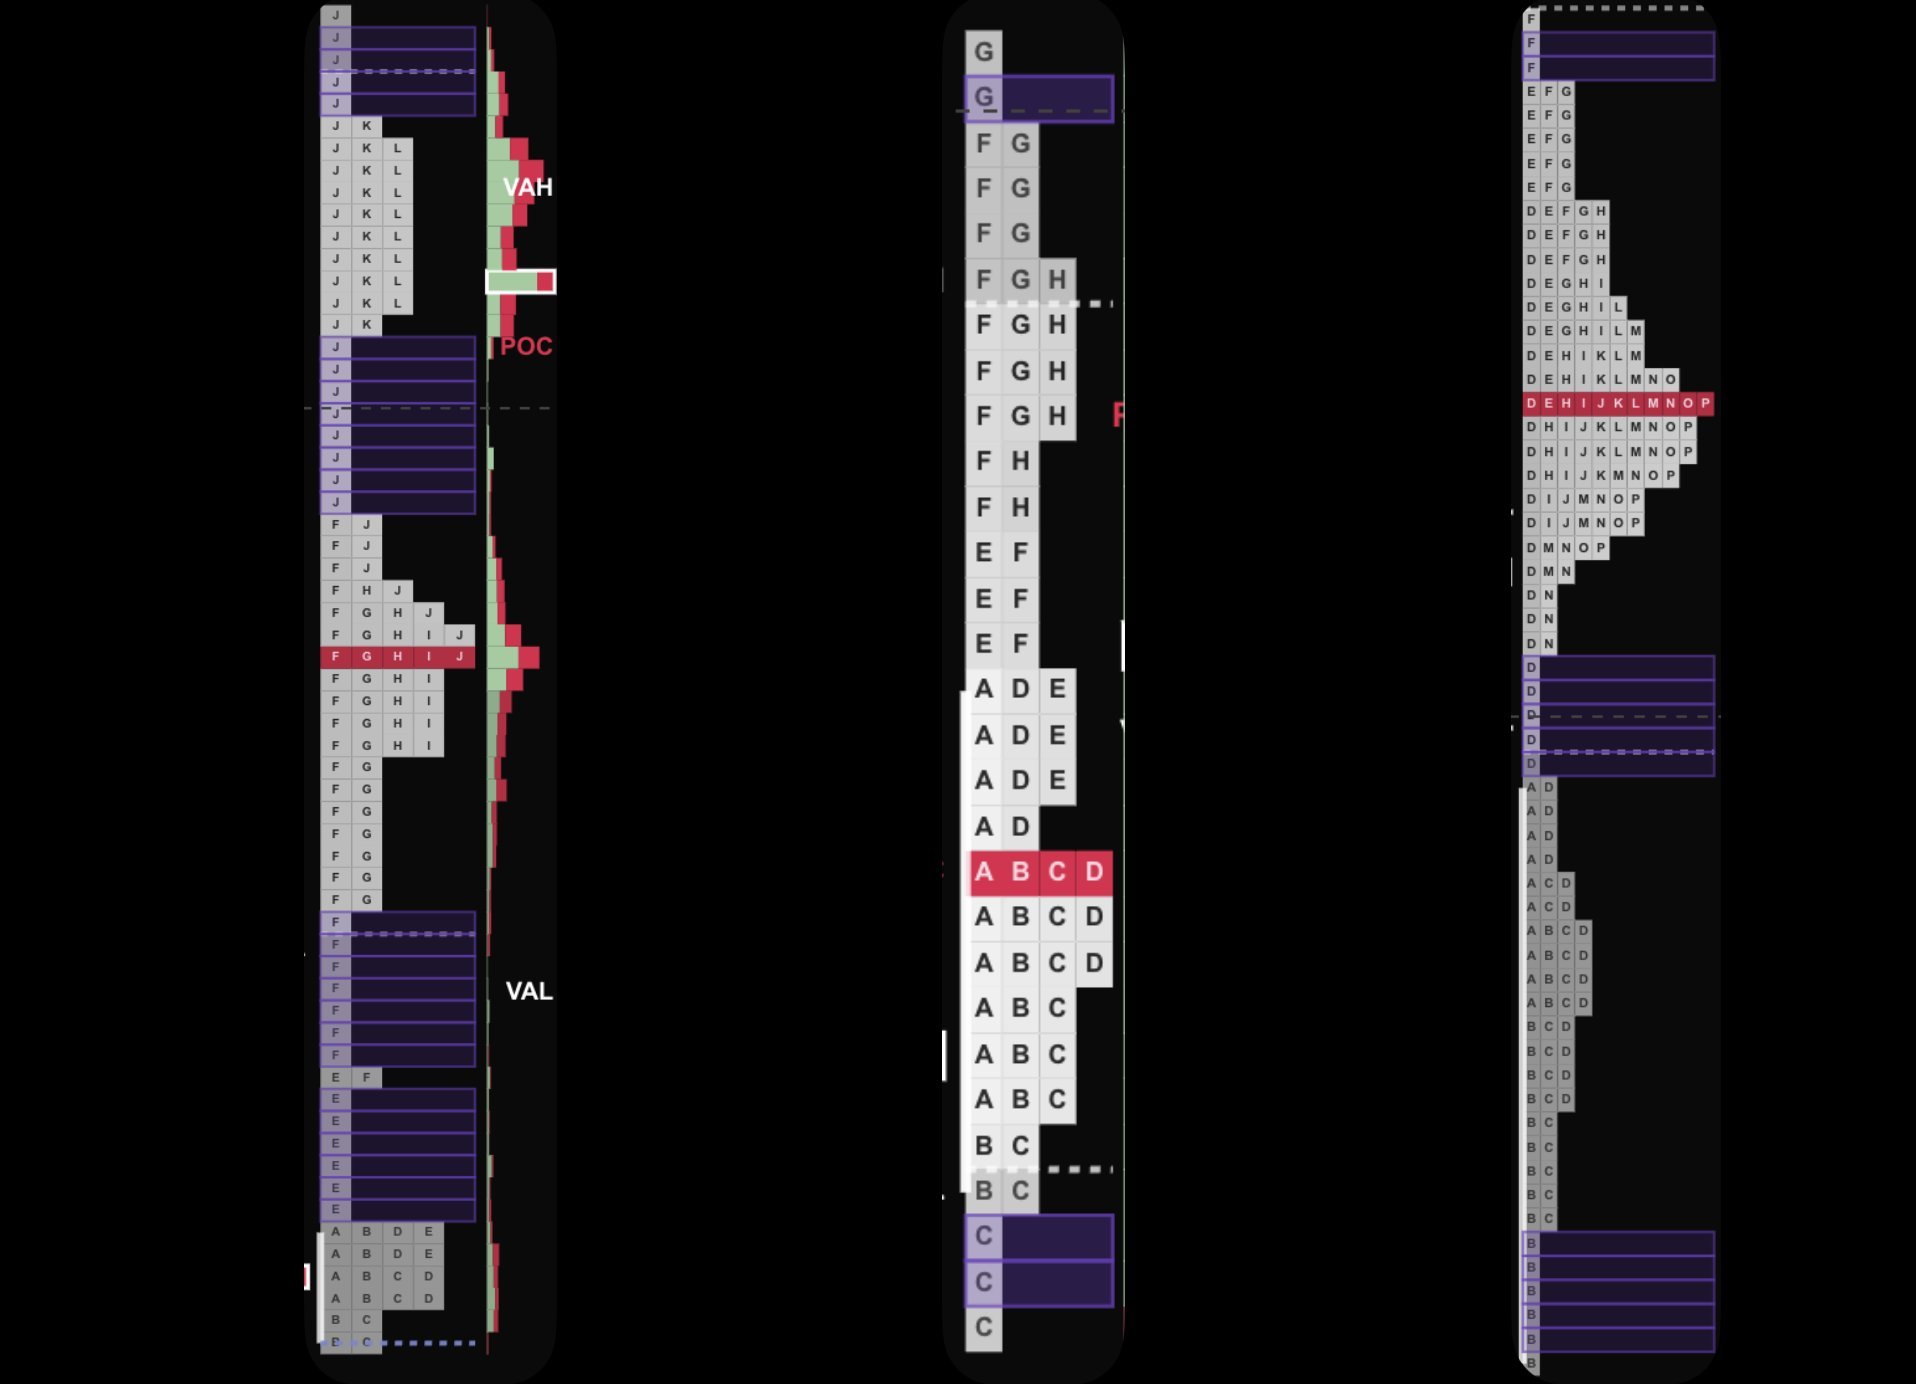
Three different days of uptrend with Open, Rejection, Reverse patten.
An Open, rejection, reverse pattern shows a weaker conviction compared to the example above. The tail is a little bit fatter, the fluctuation in price a little bit slower, the profile a bit sloppier.
Don't overthink it, just consider that after the first rejection, it might take some time to see the trend forming. Yet, some signs (e.g., multiple rejections with higher lows) might help you understand this earlier than others.
Still a trending day. Fade at your own peril.
Open, auction
Price opens and trades in a range. It's the definition of a choppy day.
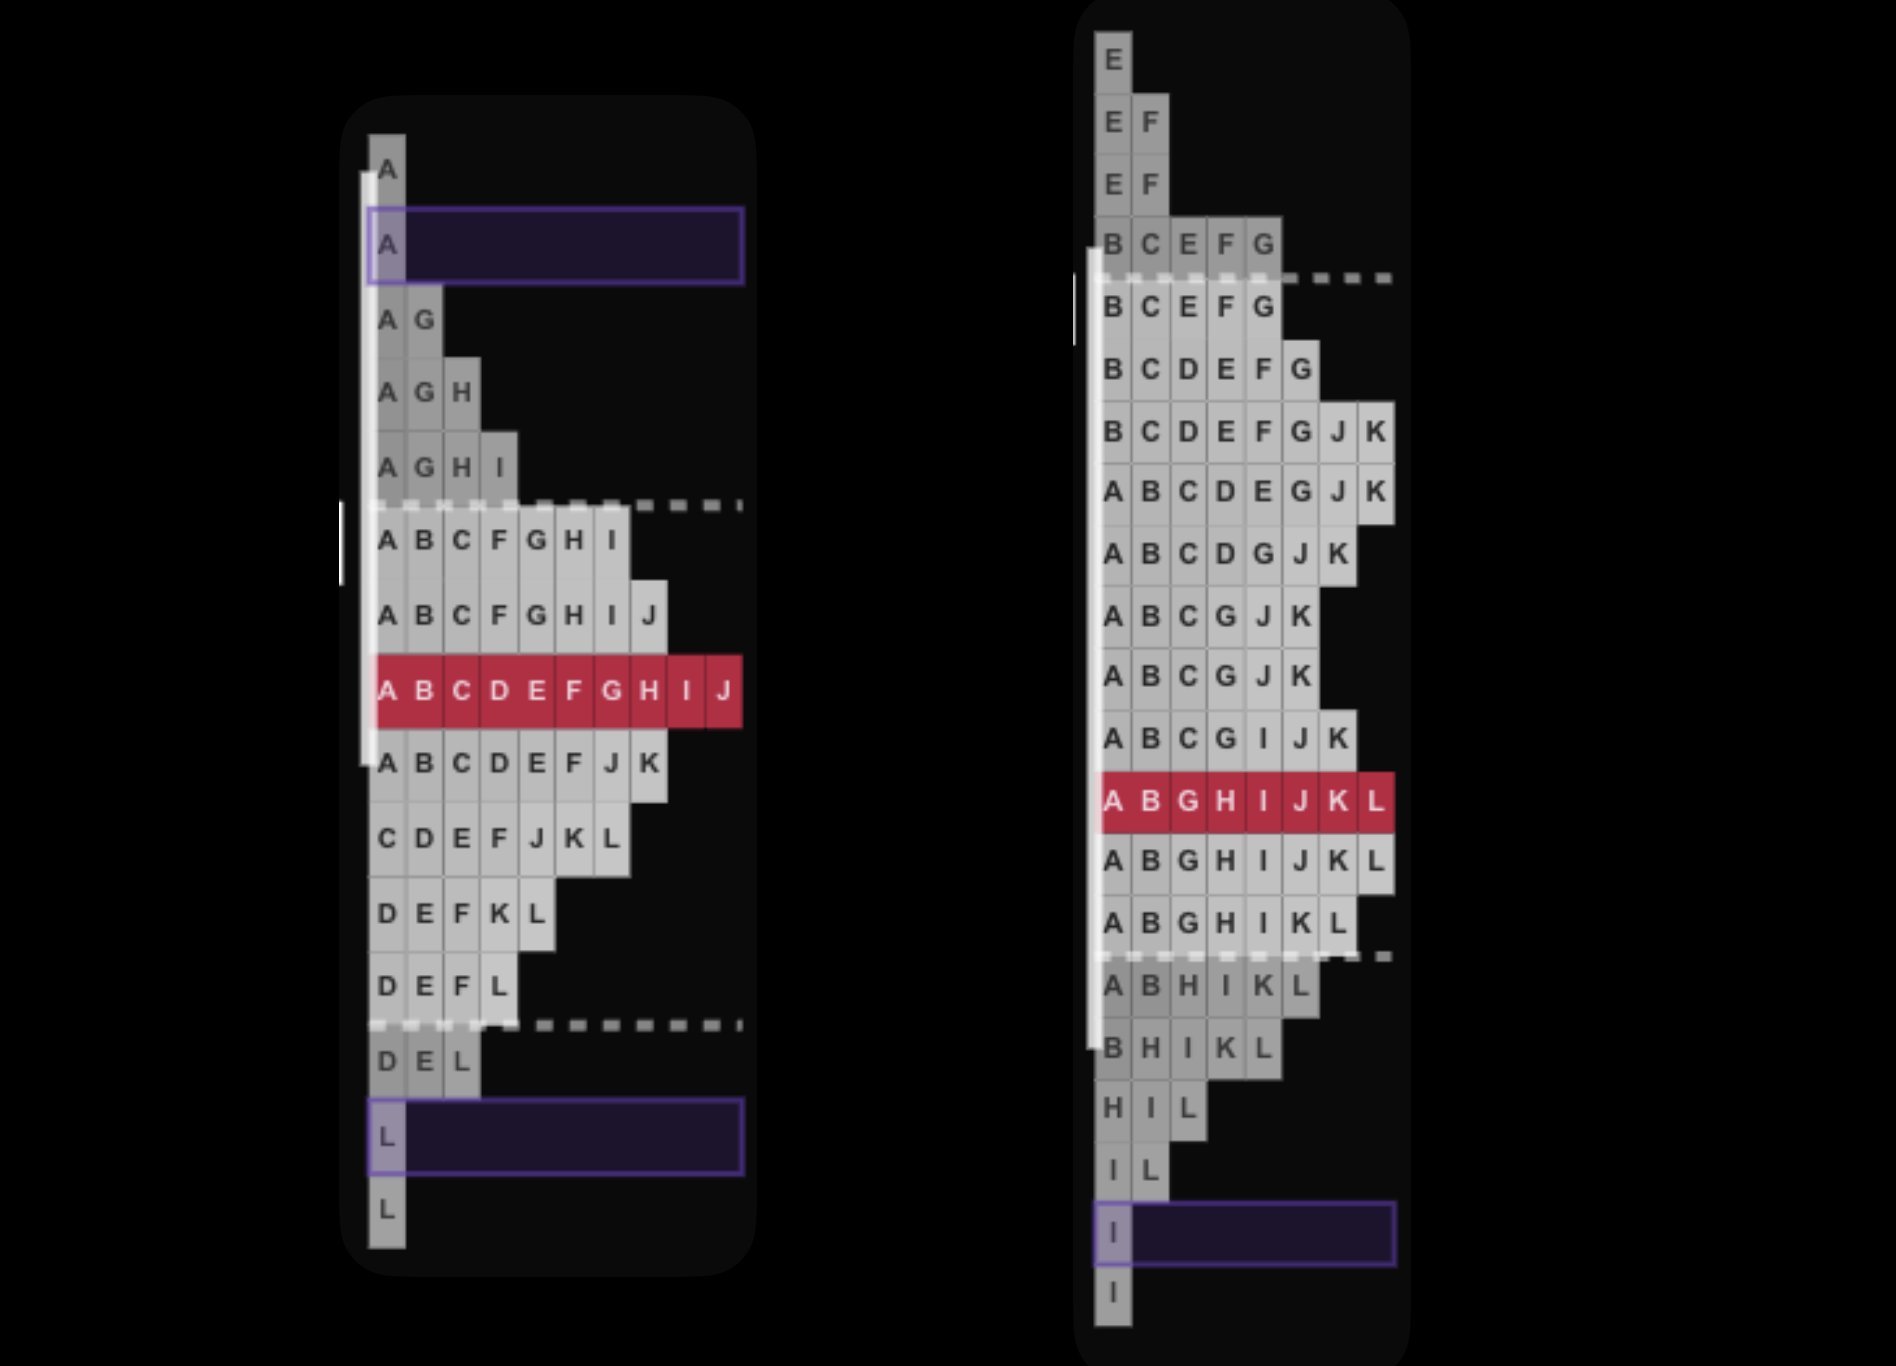
Notice how the price ranges continuously during the day. These profiles are short on the y axis (around 1-2% on
$btc).
Price will try to revert to mean.
There could be a slight trend upwards or downwards, but you know the drill.
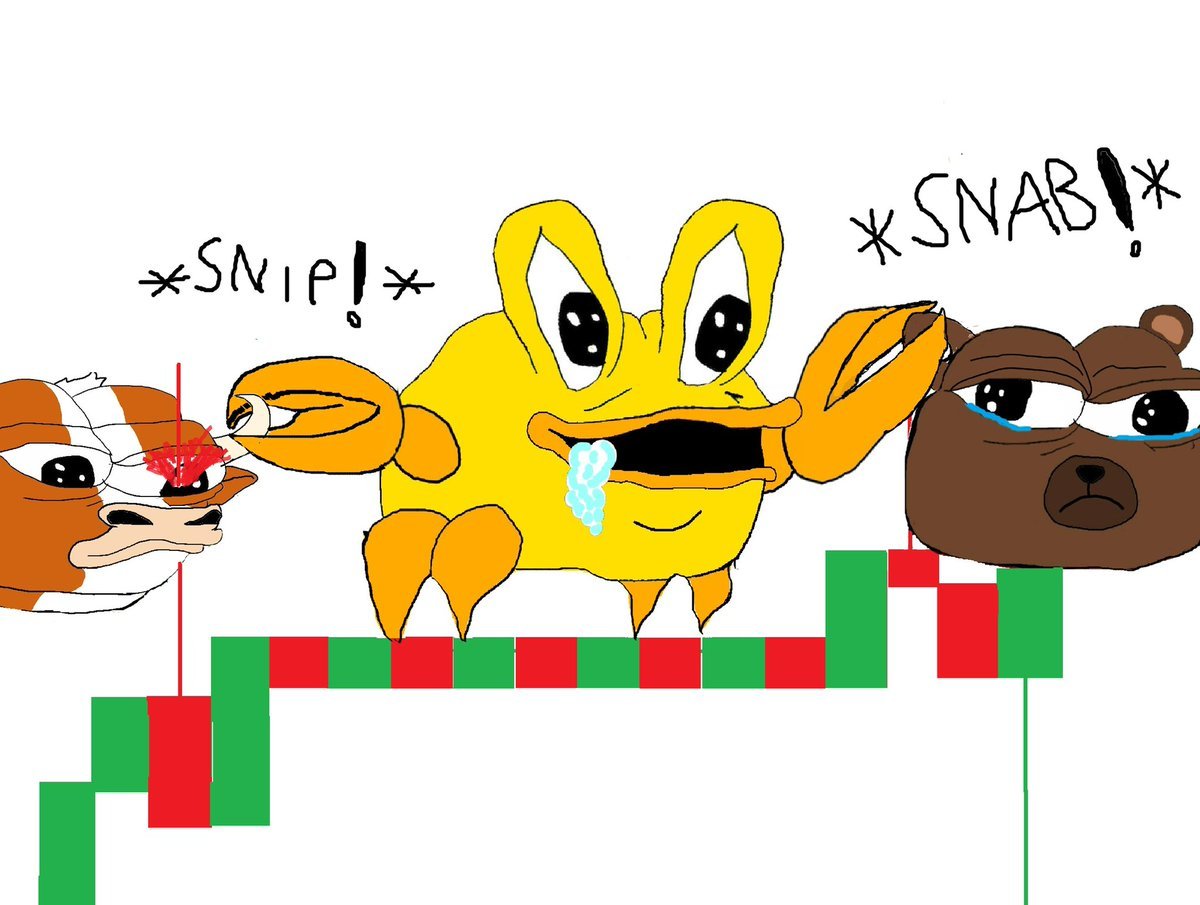
Crab time.
If you are a proficient scalper, now is your time to shine.
If not, stay away from this.
Check if you can identify any of these patterns in the previous days, as well as speculating what the IB pattern could be. Set an alarm at 2 hours into the trading session (4 periods of 30 minutes: A, B, C, and D) as a deadline, and try to write it down within that window.
Don't trade it yet, just exercise your eyes and brain for now. See how many you can get over a week.
Until next time.