Market Profile Series #3
If you're still here after the first two articles, the time to step up the game has come. We will learn how to buy low so we can sell high.
0. Foreword.
We're going to delve into some more complicated topics, but you're smart enough to have read my previous two articles and won't have any problem understanding what's going on here.
I've put a lot of pictures so you can keep the attention up for 10 minutes straight. It's a lot of material. I tried to pre-digest it for you. It's still difficult.
However, if market profile was easy, it would be for everyone, and then everyone would make money. Few people make money.
1. No one's coming after you.
People obsess with whales and large market makers (institutions, Wintermute, $MSTR, the Bogdanoff twins, the reptilians, etc.).
The majority of traders out there honestly believe there's such thing as a stop loss hunt, and MM are in heat-seeking mode, hell bent on placing their orders just below your $150 position's stop loss.
However, as usual, the majority of people think they are largely more relevant than they actually are.
I'm not saying you're irrelevant. I'm just saying your relevance is very small in the large scale of the market. You're plankton. Although you're accidentally part of their diet, whales couldn't see you if they tried.
You're just in their way.
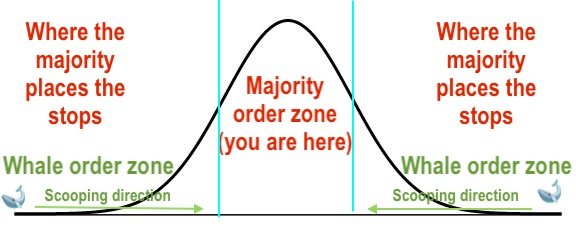
Don't sit in the scooping trajectory, anon.
Today, we learn how to get the f*ck out of the way and maybe even swim with the big cetaceans.
2. Liquidity composition
More than 90% of the daily trades are made by algo bots (probably >70%) and retail traders. Algo bots are managed mostly by institutions, generate several thousand high frequency trades that open and close in a few ticks, and provide liquidity to the market.
They set the daily IB, and produce the air that allows us to breathe: liquidity.
Intra-day trading is the major componen of the market participants. A large minority is composed of swing traders, who usually move in timeframes spanning from a few days to a few weeks.
And finally, you have high-timeframe, large-size moves. They are often bids and asks that come from whales and MM. Large trade size orders are a rare occasion. Usually, these movements correspond to rare high-timeframe events.
And when MM book large orders at once, it's for a good cause.
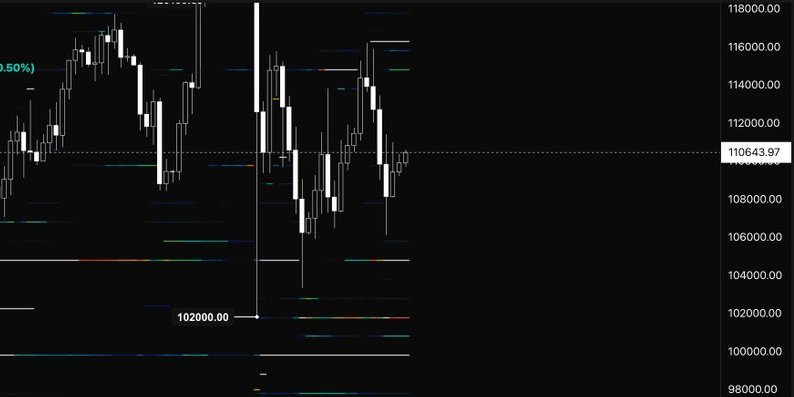
The heatmap displays concentrations of orders between 50 and 115 $btc lots (colder to warmer for reference). The long wick down is the 10/10 liquidation event.
This heatmap is easy to use and you can chart relevant orders and their absolute positioning. It's available for free on @kiyotaka_ai
3. The fallacy in your behaviour.
Chances are, most stops are set in those high liquidity areas. Our monkey brains recognize patterns, and if you aren't a complete tard or an absolute genius, there are high chances that you move exactly like the rest of the majority.
YOU. ARE. PREDICTABLE.
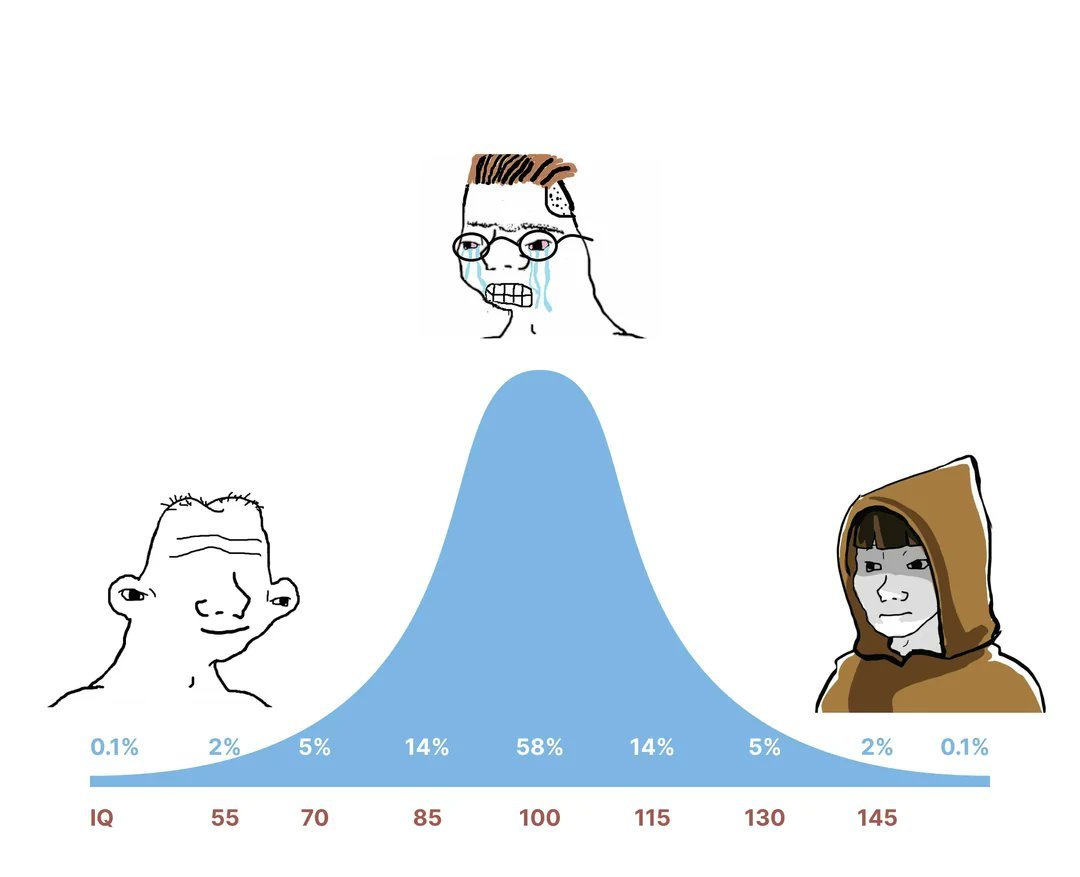
You're probably in the middle, crying because you got liq'd once again.
You draw the same support lines, anything below that invalidates your point, and a little lower lies your stop loss. The candle spikes just below, you get stopped, and then price reverses and leaves you behind 1.5% poorer (not accounting for leverage). Death by a thousand cuts.
Sadly, I cannot teach you how to be high IQ, it's too late for that, anon. If you're high IQ you wouldn't bother reading this.
Perhaps I can teach you how to be an absolute tard. You won't need to understand how high-IQs think, but you can coerce the few brain cells you have left to act as mirror neurons and copy what the gigabrains do.
4. Tails.
Imagine a wholesale business that bought 10,000 bottles of soda for $1 each. They try to sell it for $2, but no one is interested in buying. After some time, they lower the price to $1.5, but nothing happens. At $1.2 someone buys a few bottles, but business is still slow. Expiration date is near, and the shop owners fear they will incur losses.
The price is then lowered to $0.90. This is when the owner of a large retail chain walks in, and buys a large part of the remaining stock, which they will try to sell for $1 (exactly the price of the last large transaction, a price perceived as fair).
The owner of the small shop increases the price to $1, and the remaining stock quickly sells out to small buyers.
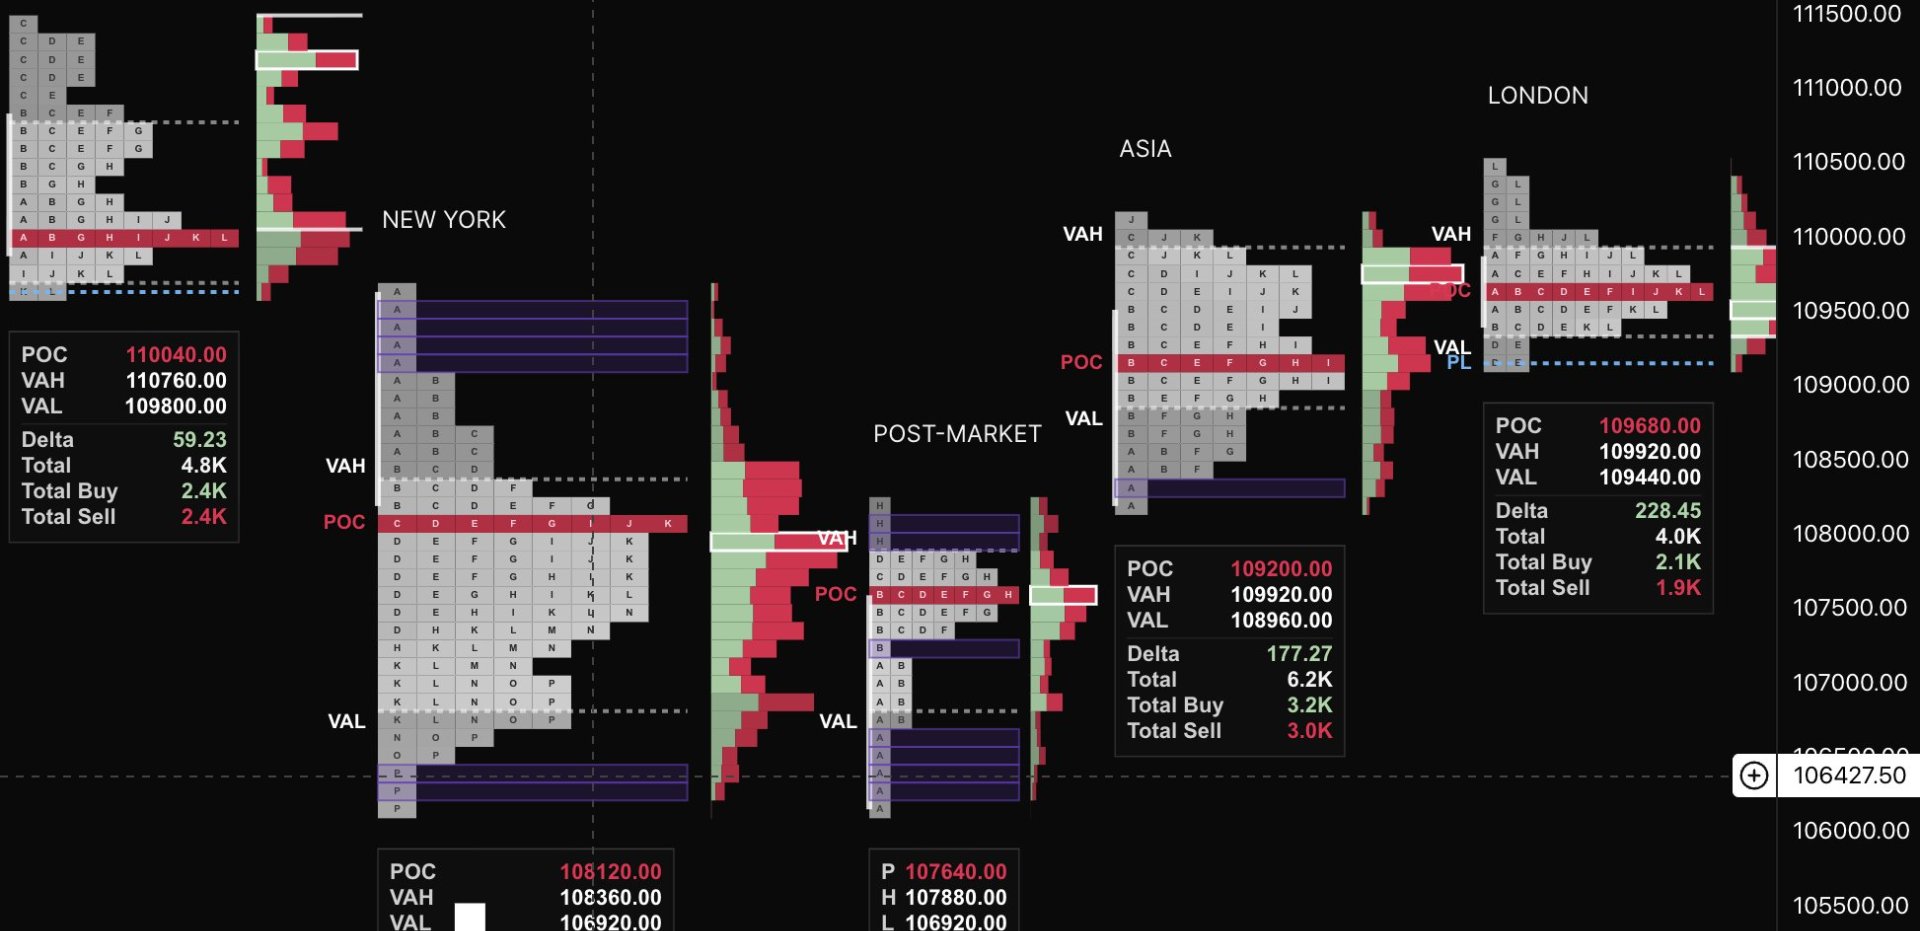
A quick rejection (selling tail) on the IB High on the NY session discourages buyers, and price moves towards the lows of 106,000. That's when big buyers step in and start aggressively absorbing asks at that range, so quickly to generate a buying tail (at least 2 single prints, for relevance).
As you can see in the image above, a second retest of the previous session's low met an even more aggressive reaction from buyers.
Let's imagine the average line guy's play:
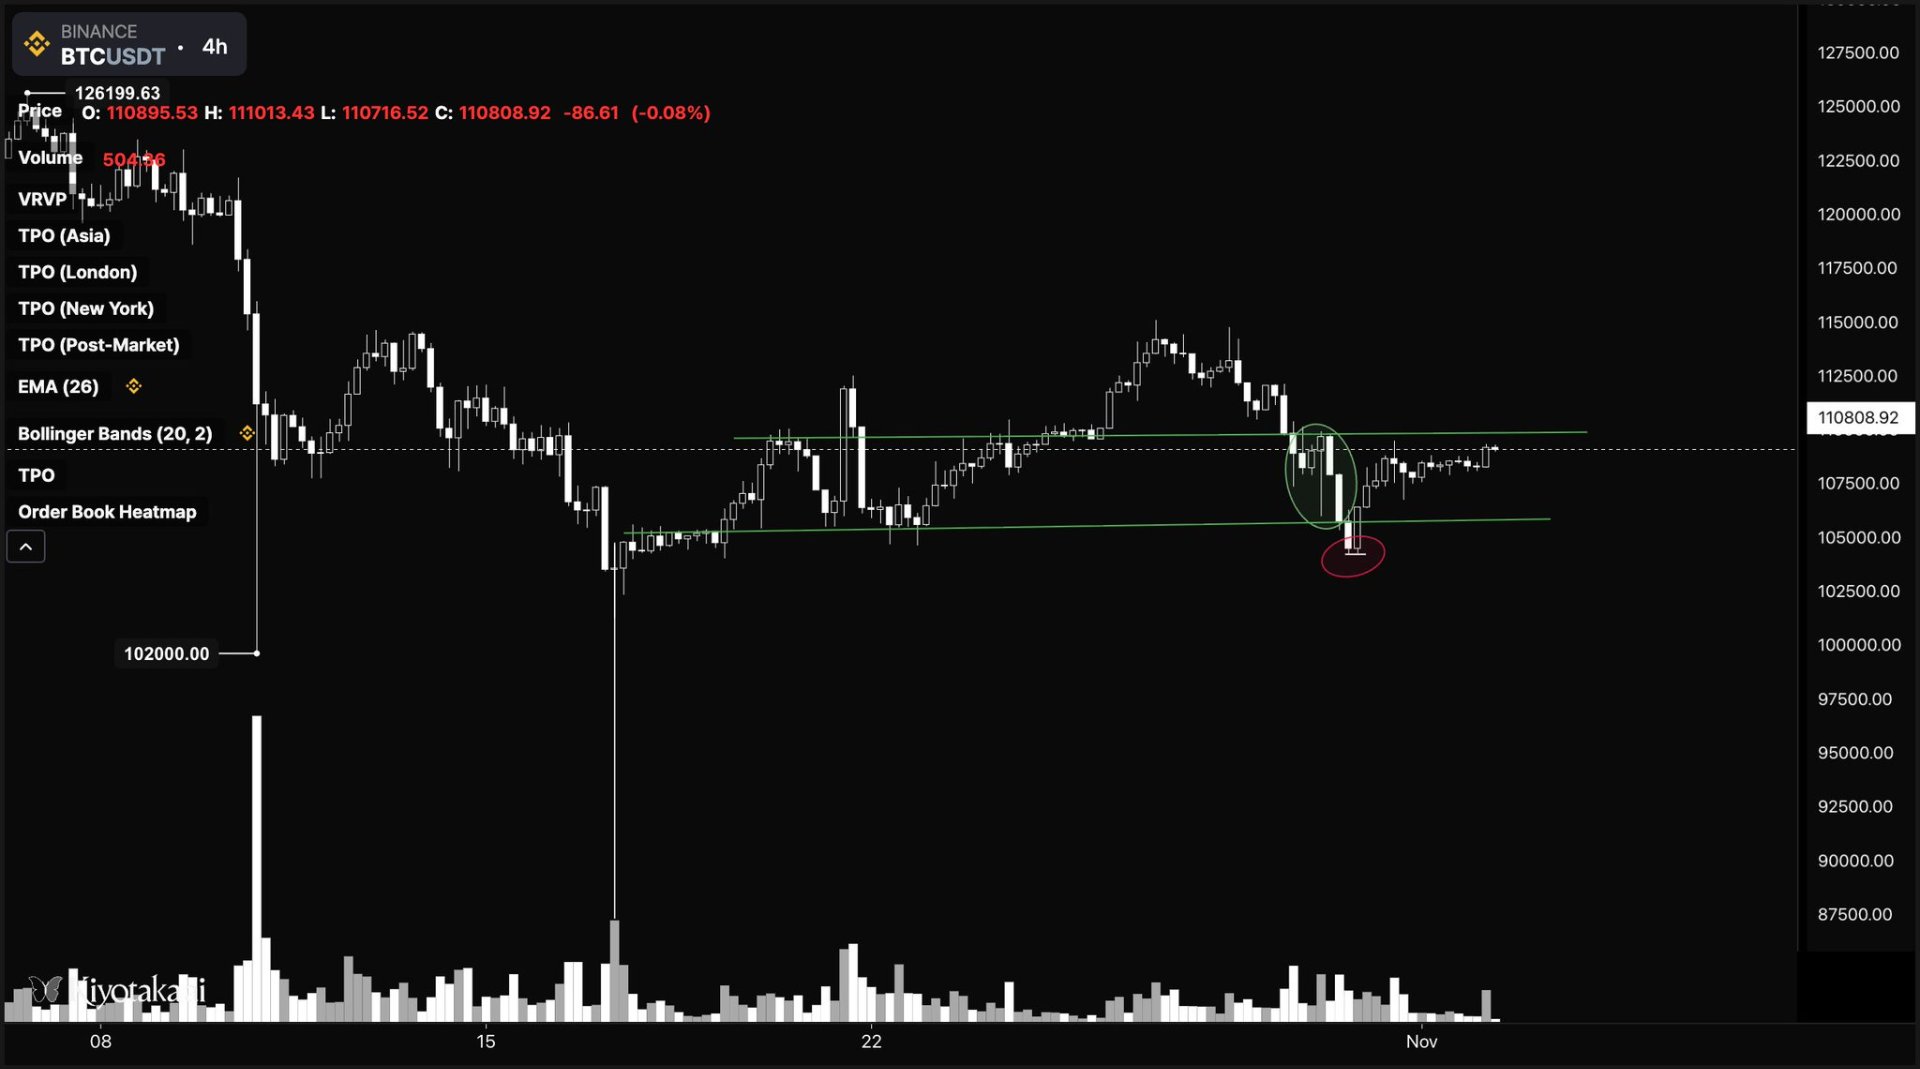
4H chart on $btc: Two obvious S/R lines. The attention areas are marked with a green and a red circle.
Let's have a closer look:
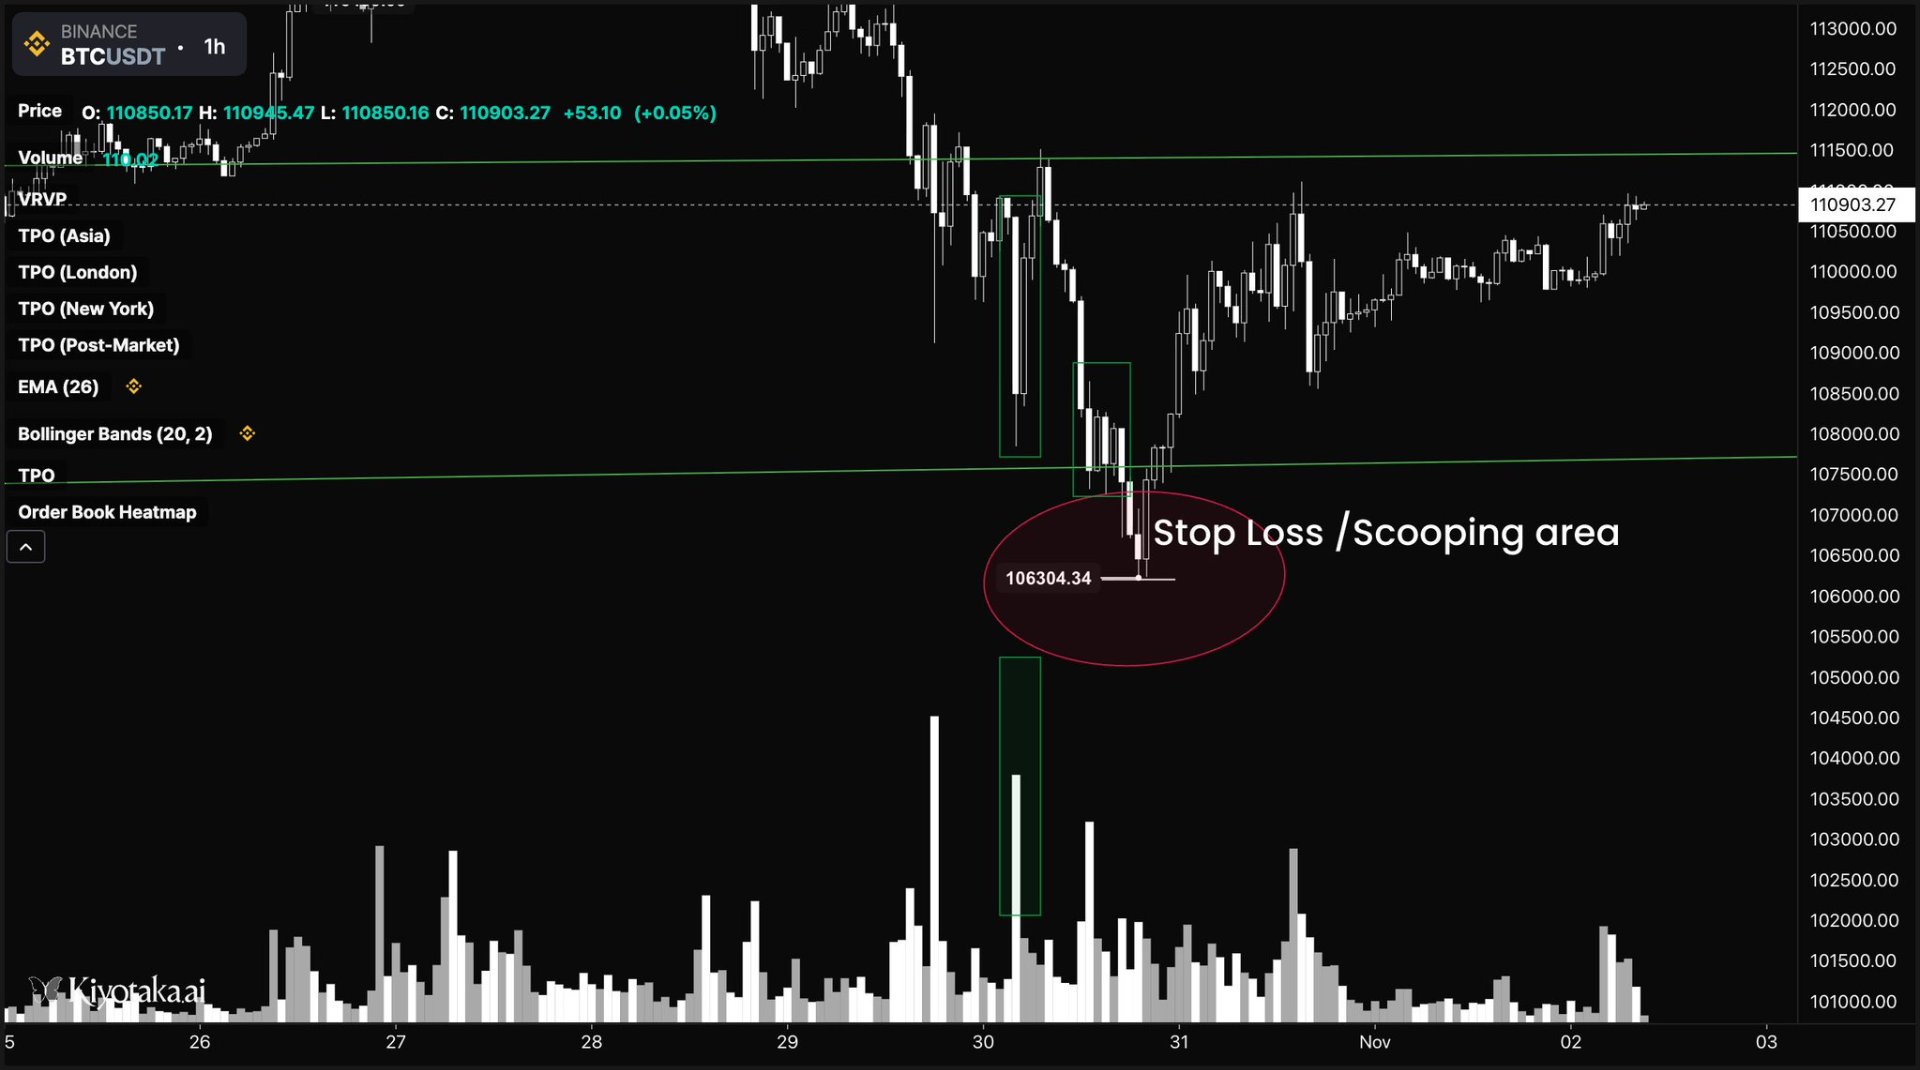
You understand where this is going?
Normie brain: Resistance flipped to support days ago. The 10/10 wicks can largely be ignored. Large rejection of sellers when getting closer to the support line. Volume decreases, and a big engulfing candle signals sellers' exhaustion.
Normie buys between 108,500 and 110,500. Stop Loss: 106,800 (RR 2:1 or whatever the hell they do these days).
Price dunks anon, orders start scooping up violently at 106,500.
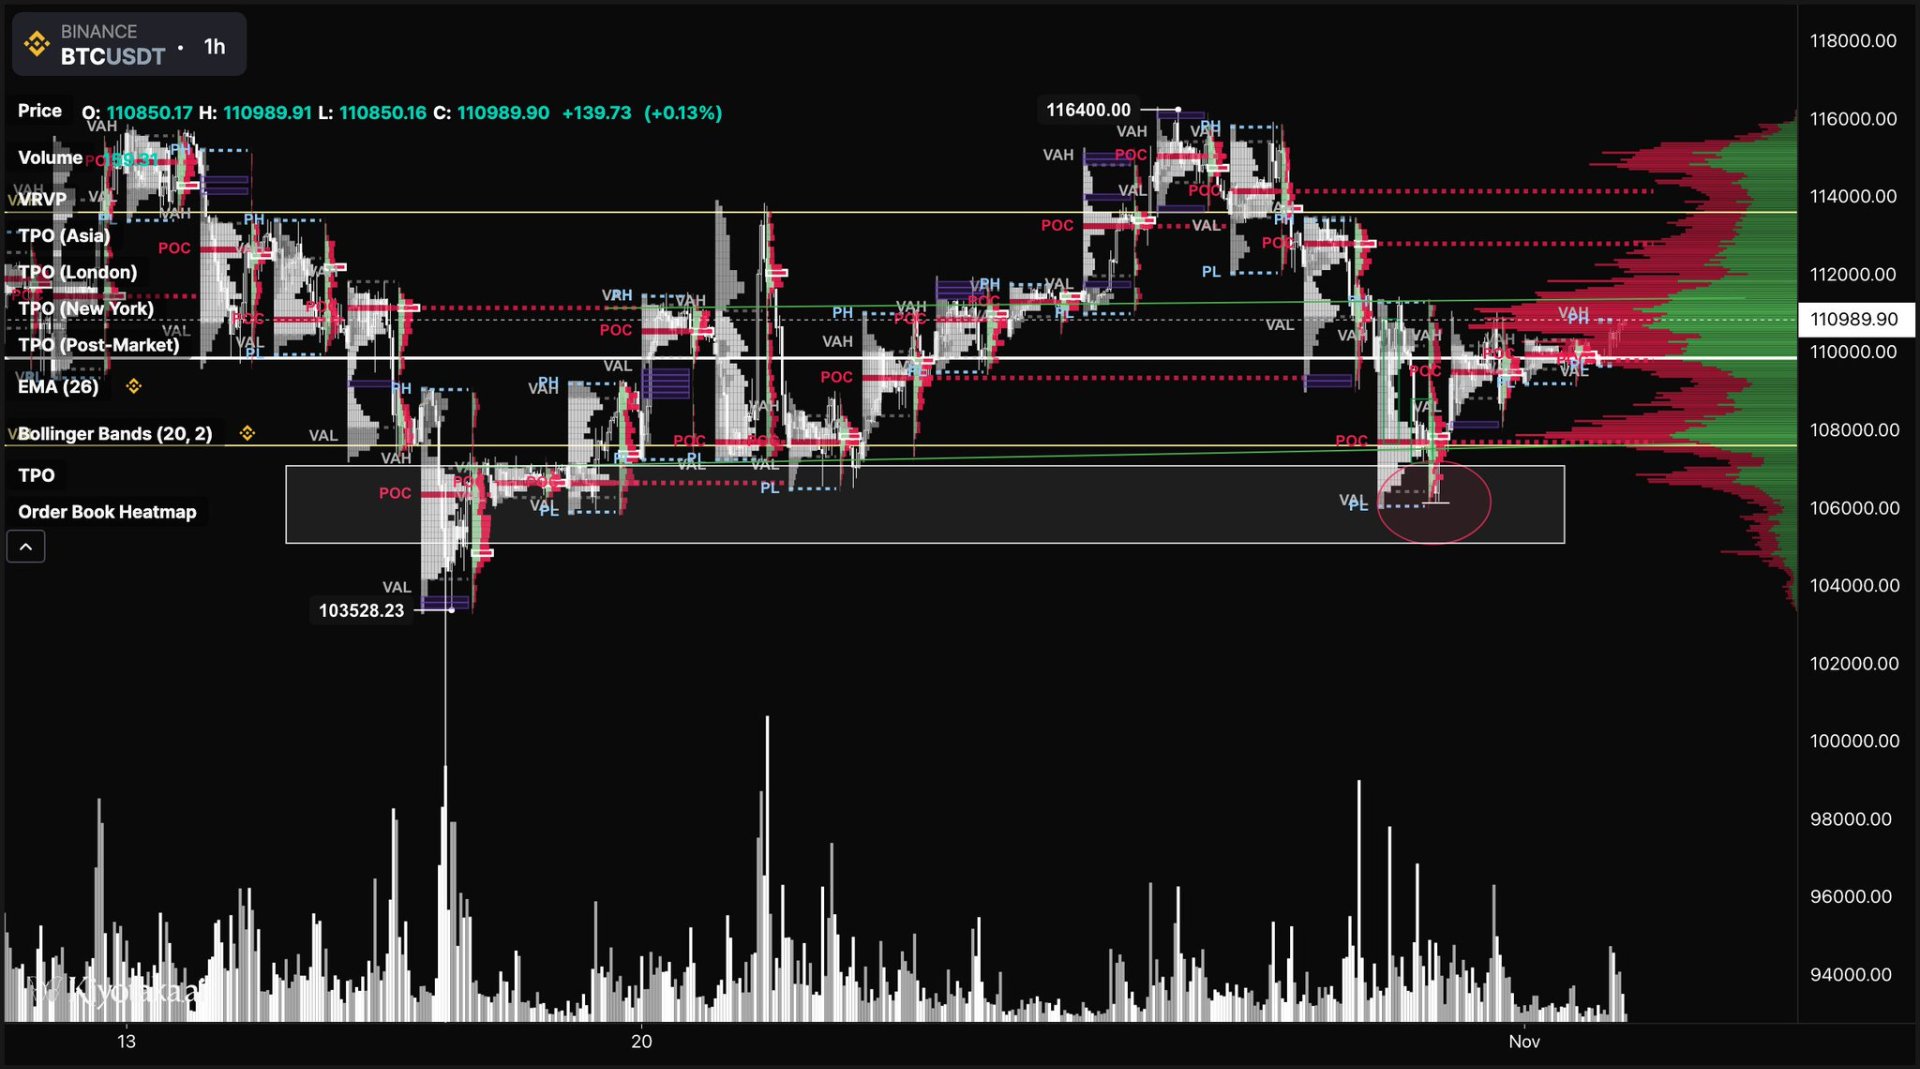
If normie used market profile and read Mazino's articles, they would've noticed several important things on the Daily session chart.
So, what do we notice in the charts above and below?
- Two poor lows on the daily sessions weeks prior.
- Imbalances (skewed profiles, poorly distributed) in the downtrend, signaling weakness when approaching support.
- Low Volume nodes on the VRVP (just below the volume profile VAL, bottom yellow line).
- Found out that if a support exists, it is at the leftmost end of the gray rectangle in the chart below.
- There lies: a) a first profile with single prints, signaling aggressive bidding near those lows, b) every time lows are revisited (two more times), a poor low is registered. Zooming into the session profiles, the findings are even more conclusive:
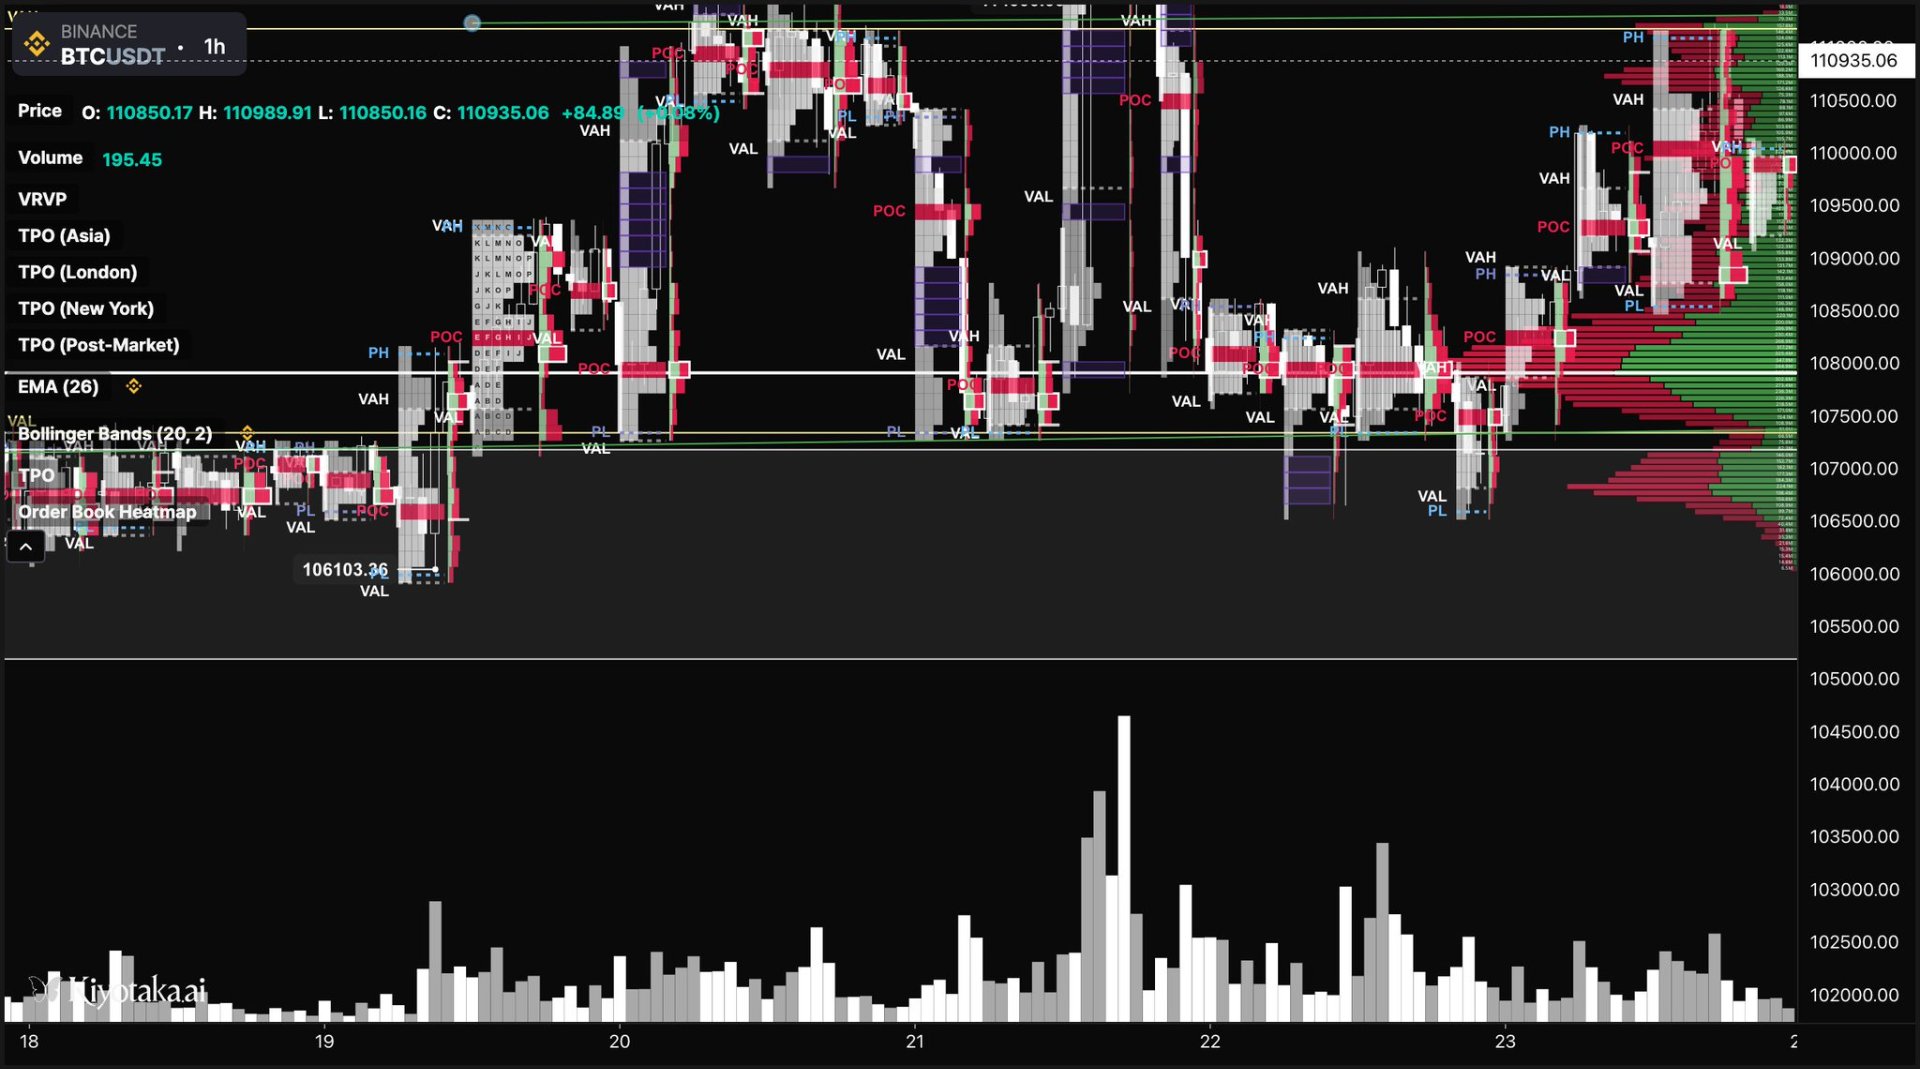
Just below Anon's support lies the perfect area to place a bid.
Look at the picture: anon bought at the bloody POC! The fair value! We want it cheaper! (below the VAL)
This is the rationale to follow when placing a limit order. If you identify interesting points on Market Profile charts, try to simulate a normie play. You want to invalidate every single point of it.
Then place your orders accordingly. 90% of people here lose money. If you do something different, while basing your decisions on market-generated intel, chances are you're right.
Forget price action. Look at value.
Until next time, stay safe.