Market Profile Series #4
Alright babes, you’re getting better. I think it’s time to get serious with you. Today we try to understand how to develop a trading strategy based on market profile.
1. Auctions
As we saw in the previous articles, the initial balance is a key level for the day. When a long-term participant steps in and takes out IB high or low by pushing the price higher or lower, respectively, we have an auction .
Auctions can succeed or fail. Revolutionary statement, I know.
An auction begins with an auction point, meaning the first period to move outside of the opening balance.
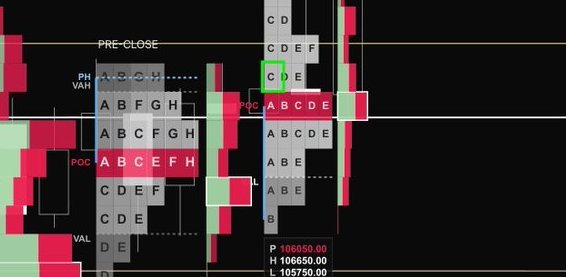
Auction point highlighted in green, 11.11.2025 BTCUSD Spot Binance
A confirmed auction point above the IB will behave as a support for the nearest future, while a confirmed auction point below the IB will behave as a resistance.
To estimate if an auction is succeeding or failing, we have two indicators, one short-term and one long-term:
An auction is confirmed if the price holds outside of the IB for 30 minutes, and fails if it returns within the IB in less than 30 minutes (one period after the Auction Point) - short term.
Some traders consider the first print. I am sometimes more conservative with slower moves, in which case I ignore the whole period during which the auction starts. It means the auction point period is not counted in the 30 minutes.An auction is confirmed when the price extends and the day closes outside the initial balance, and it has failed if the price extends outside the initial balance, but reverts and the day closes within it - long-term.
Think about it: long-term players stepped in and traded at a certain level. If they were successful, they would use it as a reference point for future trades. If unsuccessful, they will fade it next time.
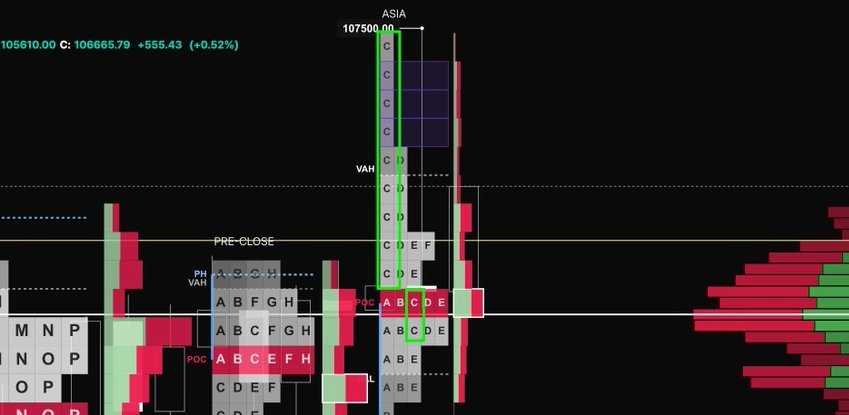
C period failed auction, same day as fig.1.
How is this useful to us, you might ask? We look for continuation after finding a good entry, so we can avoid round-tripping, right anon? You will be very sad if you round-trip.
For now, just think of a period close above the auction point. If it closes above, you can expect we will auction higher; if the closing is below, we can expect to auction lower.
2. Single Prints
Single prints can occur when the market abandons the horizontal balance and suddenly becomes vertical, with one type of orders (buy or sell) dominating without opposition.
We call the tails selling tails if they are at the top of the profile, and buying tails if they are at the bottom.
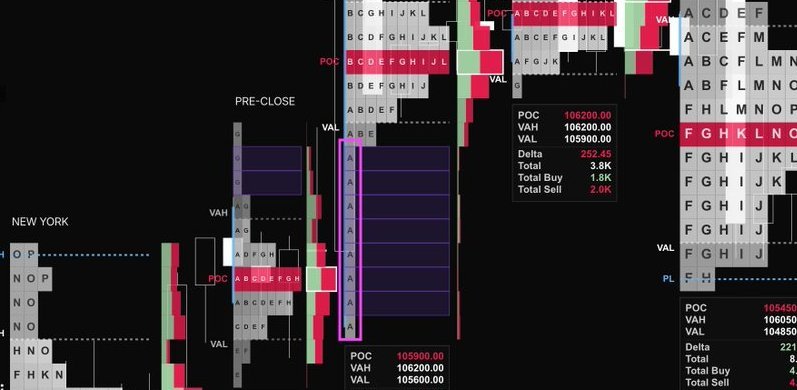
A buying tail highlighted in pink.
But that’s only half of it. Tails, like any market move, have an impetus. And the impetus usually originates from long-term market participants who decide it is time to make a move.
Now, in a general sense, any move can be a consequence of an initiative or a reaction.
Reactions oppose initiatives.
Since we are trying to be smarter, we apply cognitive reasoning when reading the market profile.
If the price moves above the opening, we will have initiative buying, and reactive selling.
If price moves below the opening, we will have initiative selling, and reactive buying.
It’s not necessarily happening at the same time. Sometimes reactive buyers will wait for a large move before they start placing bids (long tail), sometimes it will take little for them to react (short tail).
3. Today’s market’s analysis.
So, what’s going on here? First thing we do is look at market structure, right?
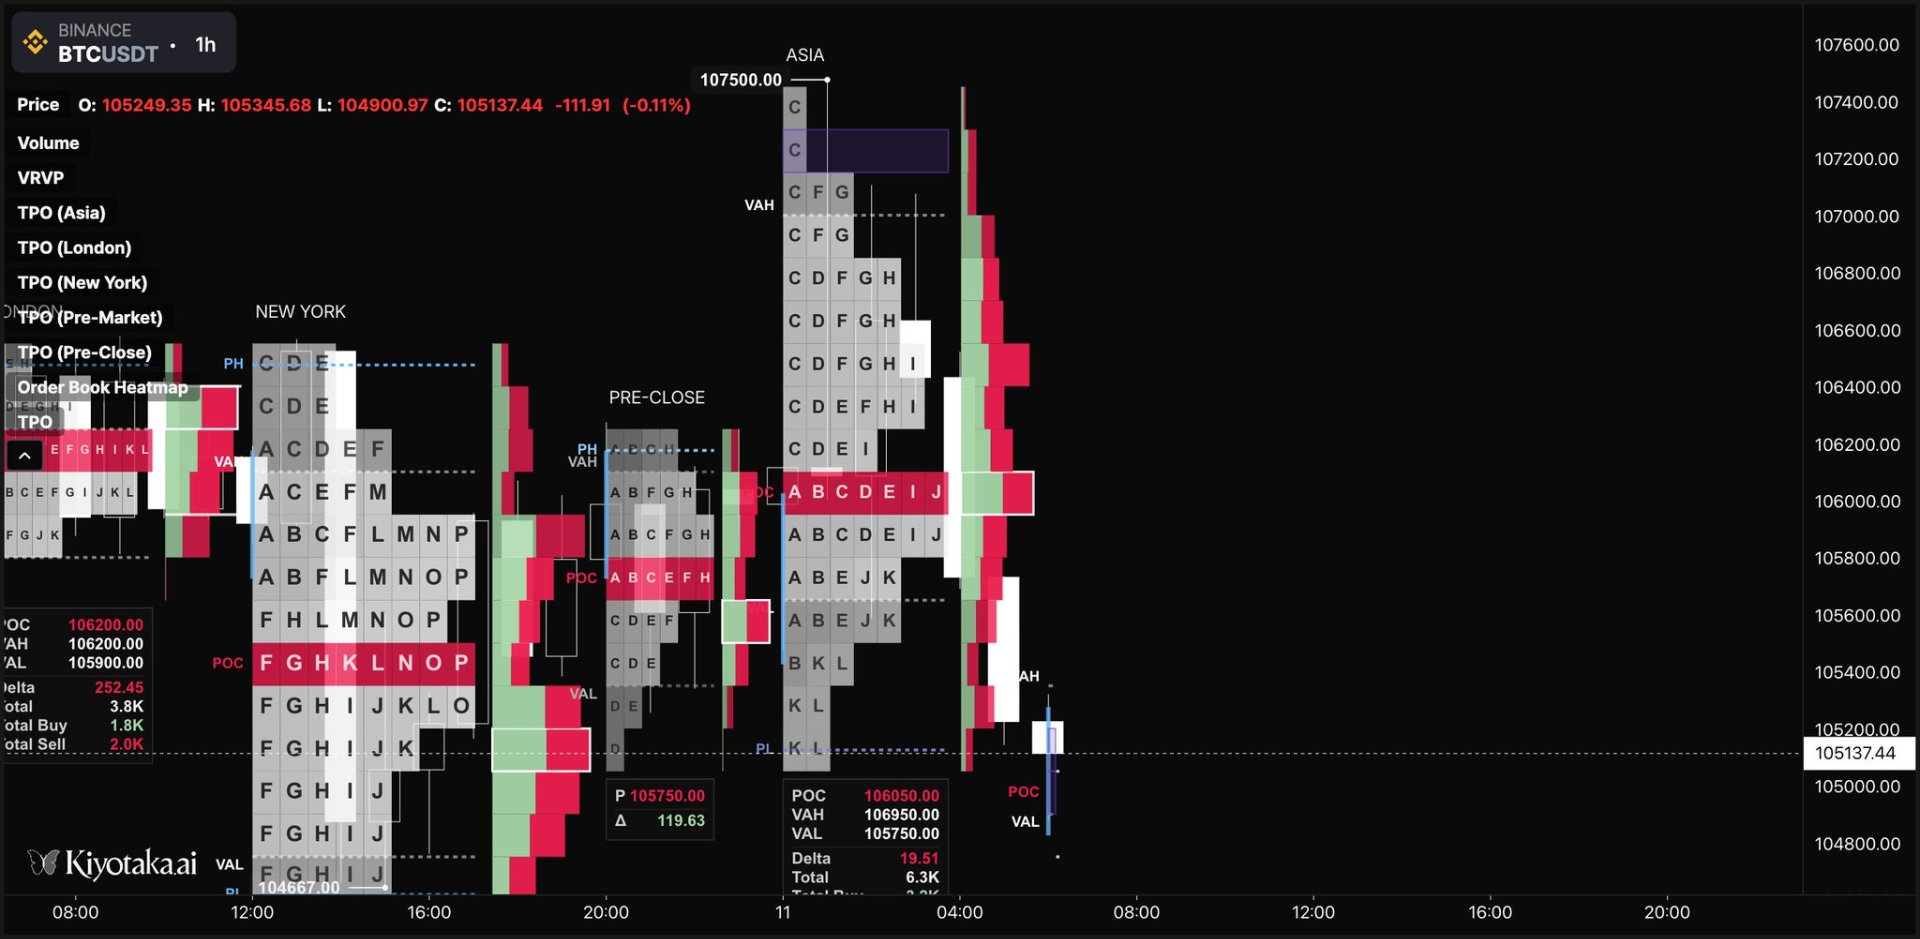
This is today’s 11/11 Asia session open. Let’s look at previous sessions.
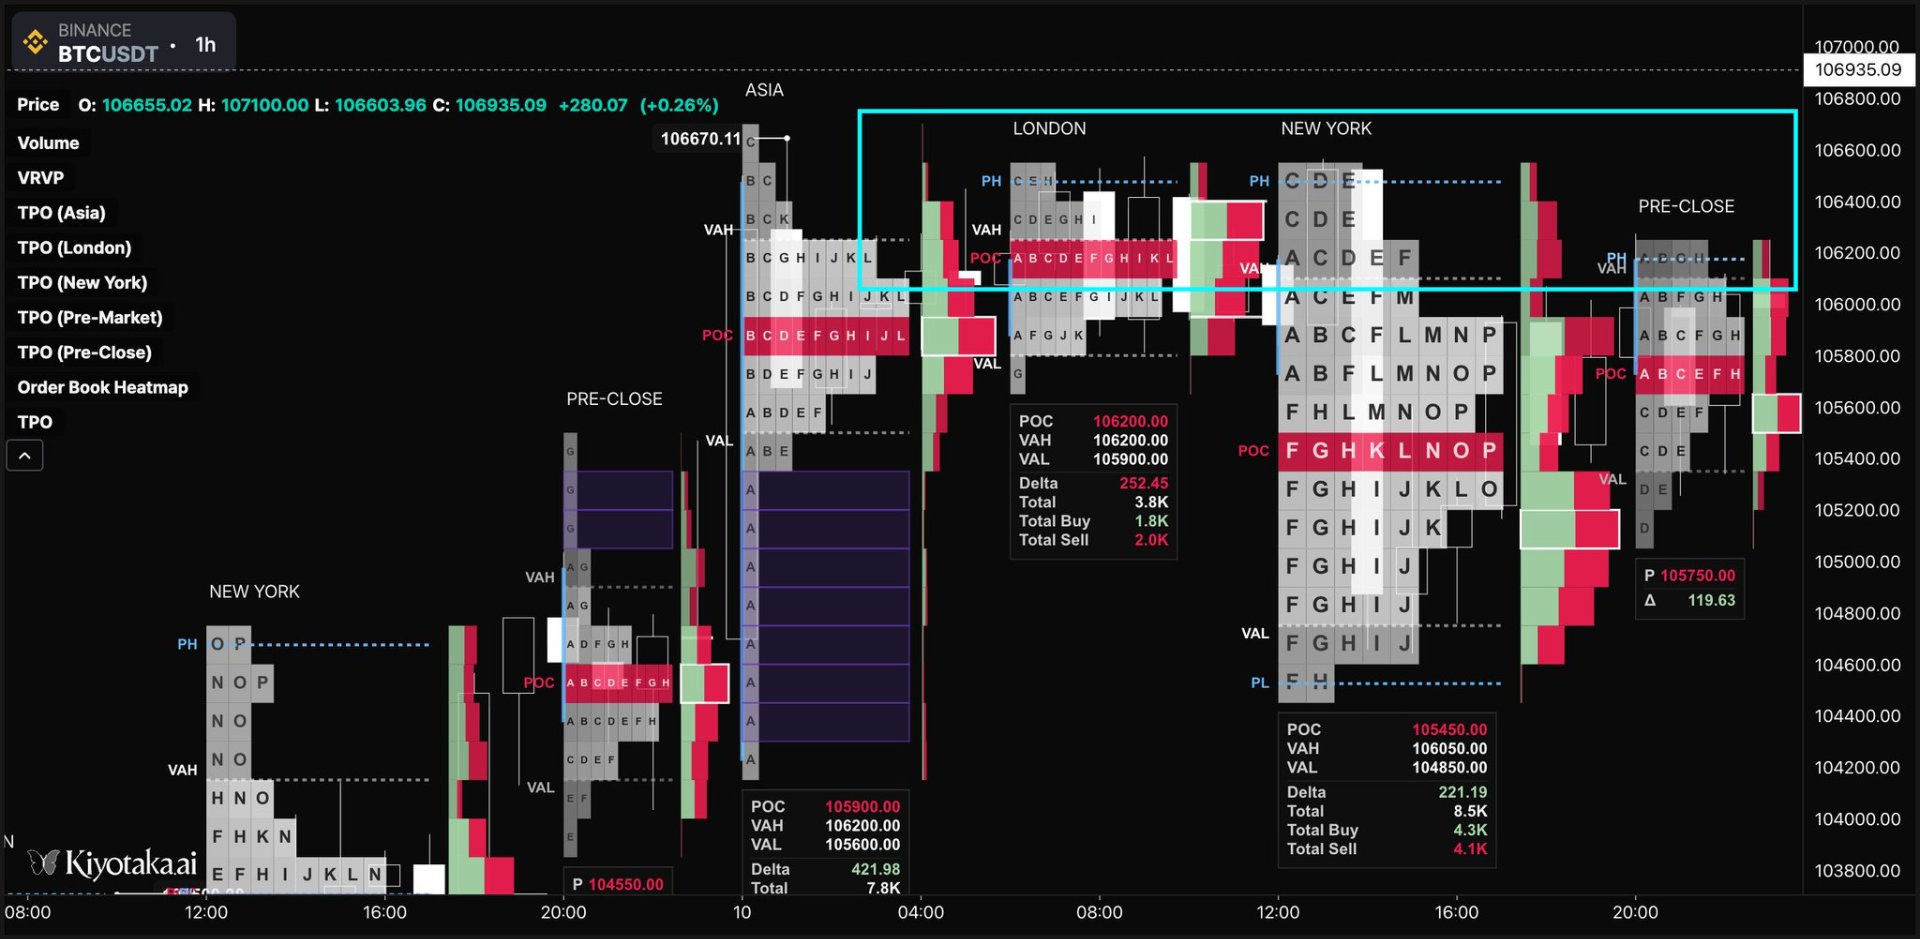
Market structure highlighting sessions previous to 11.11.2025. Poor highs highlighted.
Poor highs, many of them.
A poor high is an inefficiency: remember our bell curve? The market longs for bell curves. Price is likely bound to auction into that gap, because as a tool to facilitate trade, it wants to know what the heck is going on there. The more you have, the higher the likelihood.
It doesn’t mean price will be accepted there. It just means it has high probability of revisiting.
So Anon, what's going to happen to those poor highs?
Let’s analyze what’s going on here.
We learned previously about the opening patterns.
Let’s have another look at the opening pattern of the day:
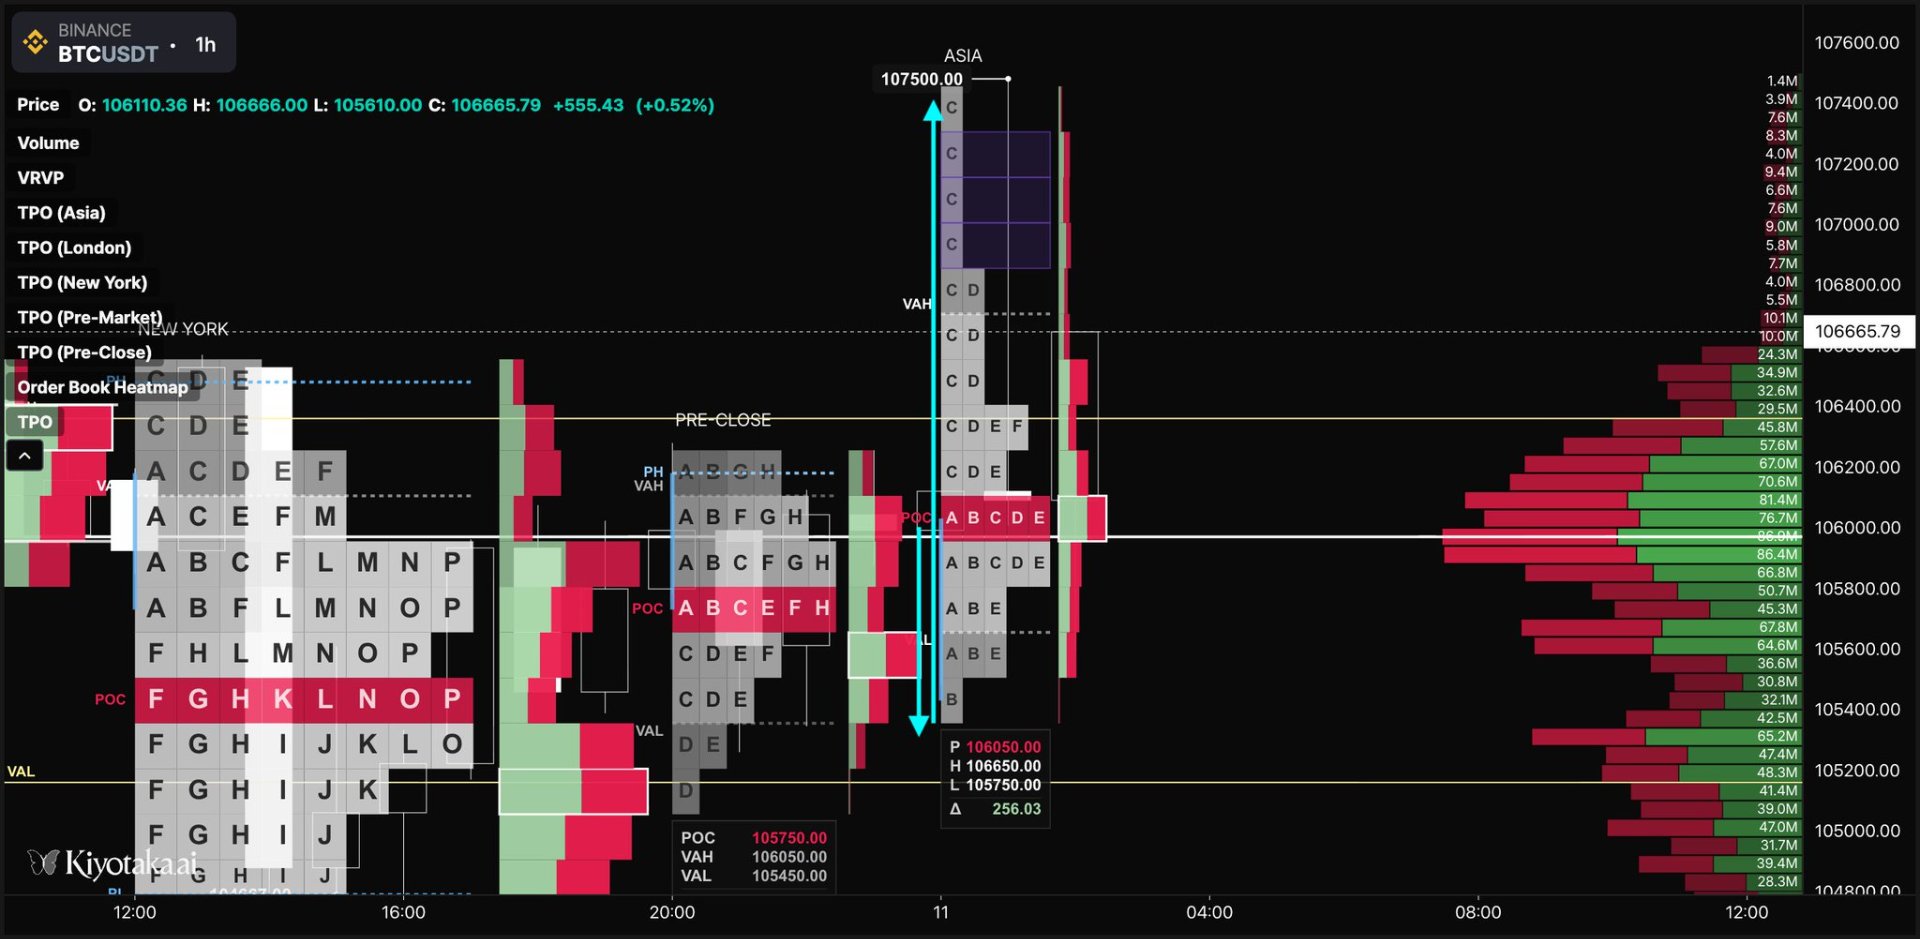
Price opens and quickly goes to set the low (open, test, drive?), and it quickly runs to explore the highs – initiative buyers are in. Oh wow, the poor high is swept.
I hope you took profit, anon. Reaction sellers want to throw hands. No business to be done here. Rejection, reverse.
Look at those single prints.
Suddenly, it’s a low conviction move.
You didn’t go long on the top, right anon?
Not only it’s a low conviction move. What else is this? Price moved out of the IB during period C.
You’re right anon, C period was an auction point.
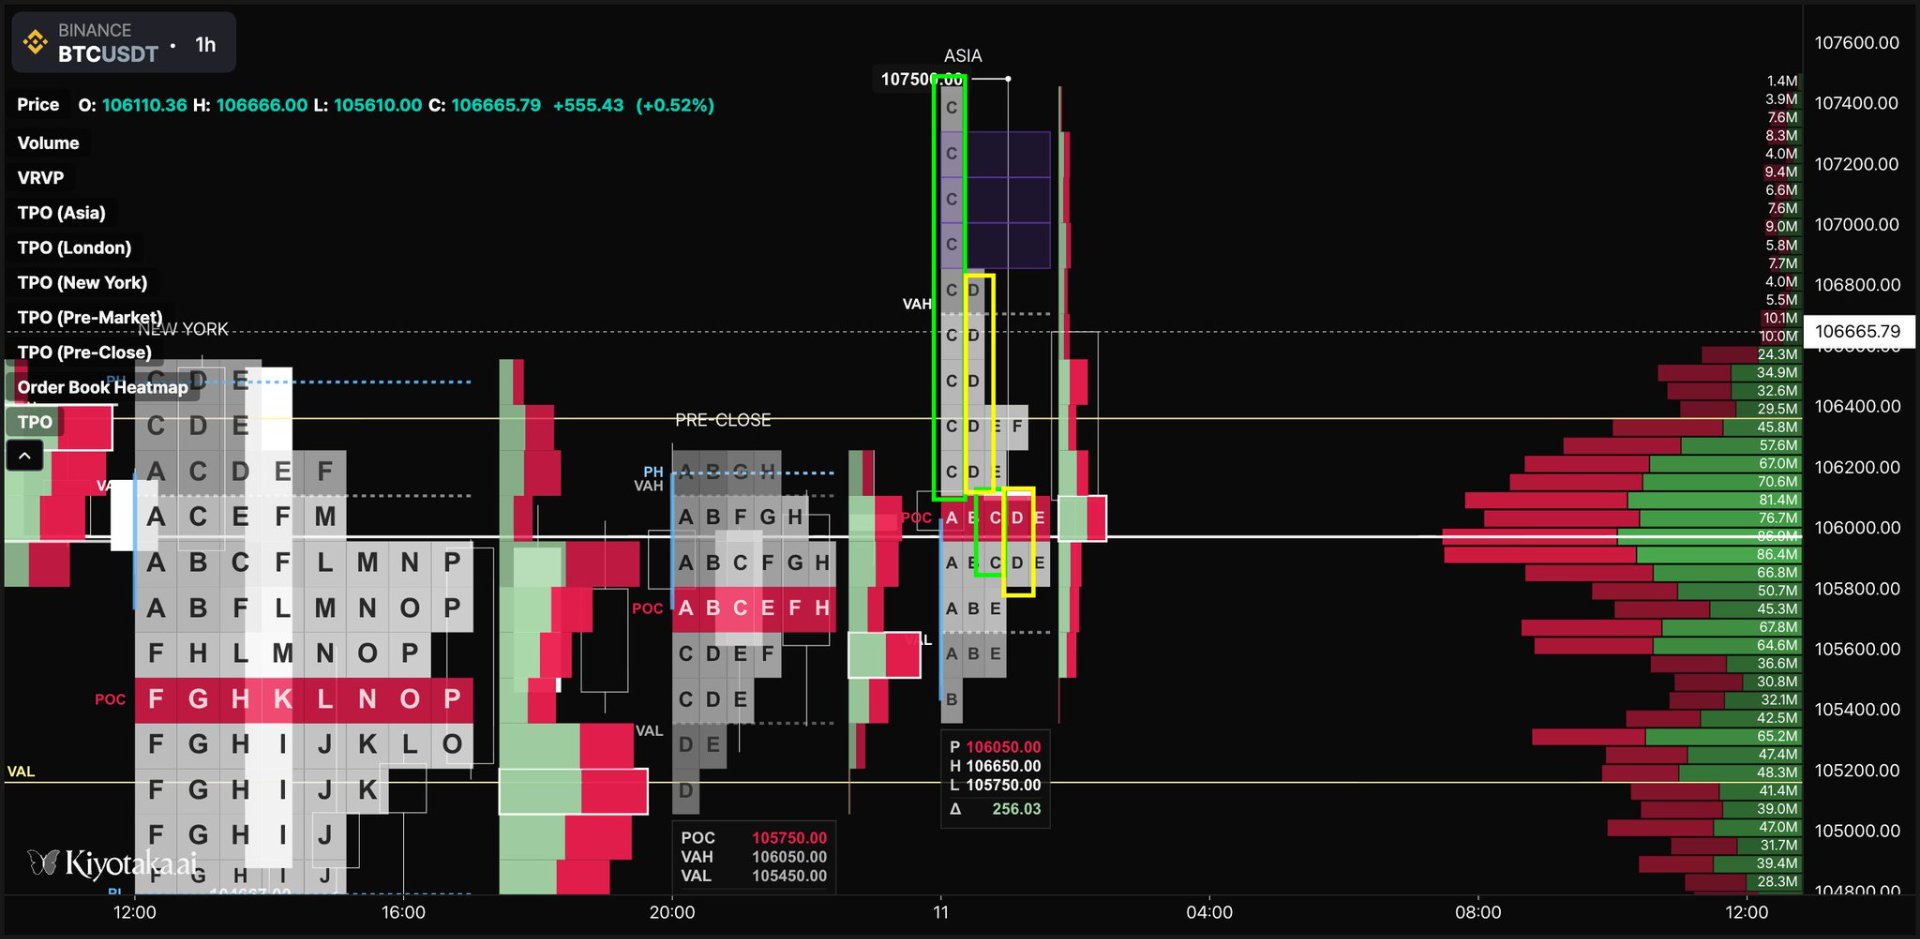
Highlighted the D period in yellow, returning back to the IB.
And during the D period, it roundtripped back to IB.
Like your gains if you didn’t take profit on the poor high.
Auction failed. See the doji candle?
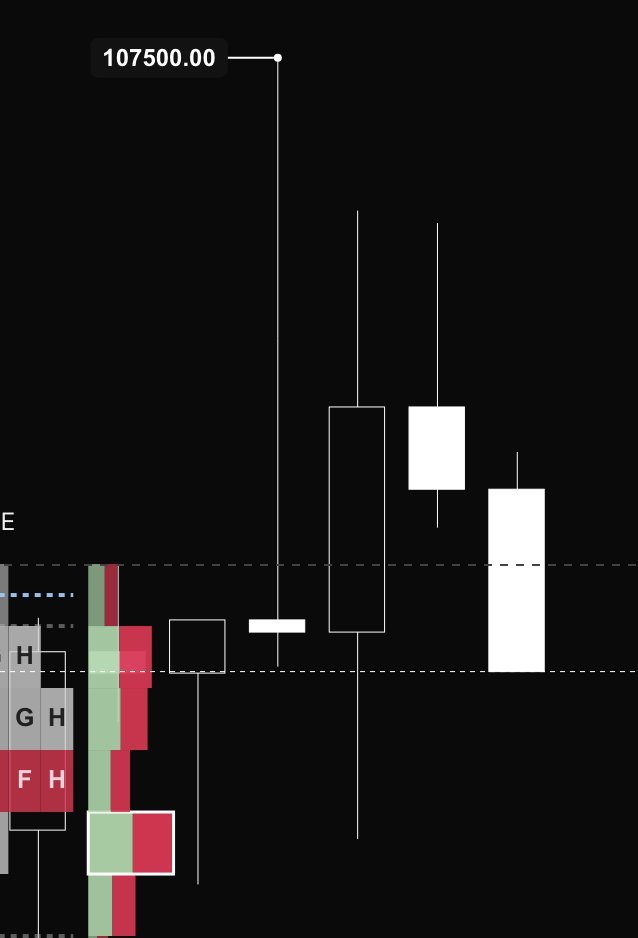
Graveyard doji on the same timeframe of C and D periods.
It’s over.
New attempts? Don’t long them, it won’t be different this time. It's over.
Remember, you can short things, especially if they show poor conviction and are reversion to mean.
What does acceptance mean here, or better, the lack of it?
We can look for it in two ways:
- As I mentioned, failure to hold at least short-term above the IB, so at least 1 period.
In this case, price spikes up in period C, and it starts reverting down during period C and lands within the IB during period D. Now, remember, you don’t want to trade blindly into a kill zone such as the Asia and London opens, or the NY open and close. This is why you wait at least 2 or 3 periods to see what’s going on. You could open a good short on period D.
On period E, price almost sweeps the IB low.
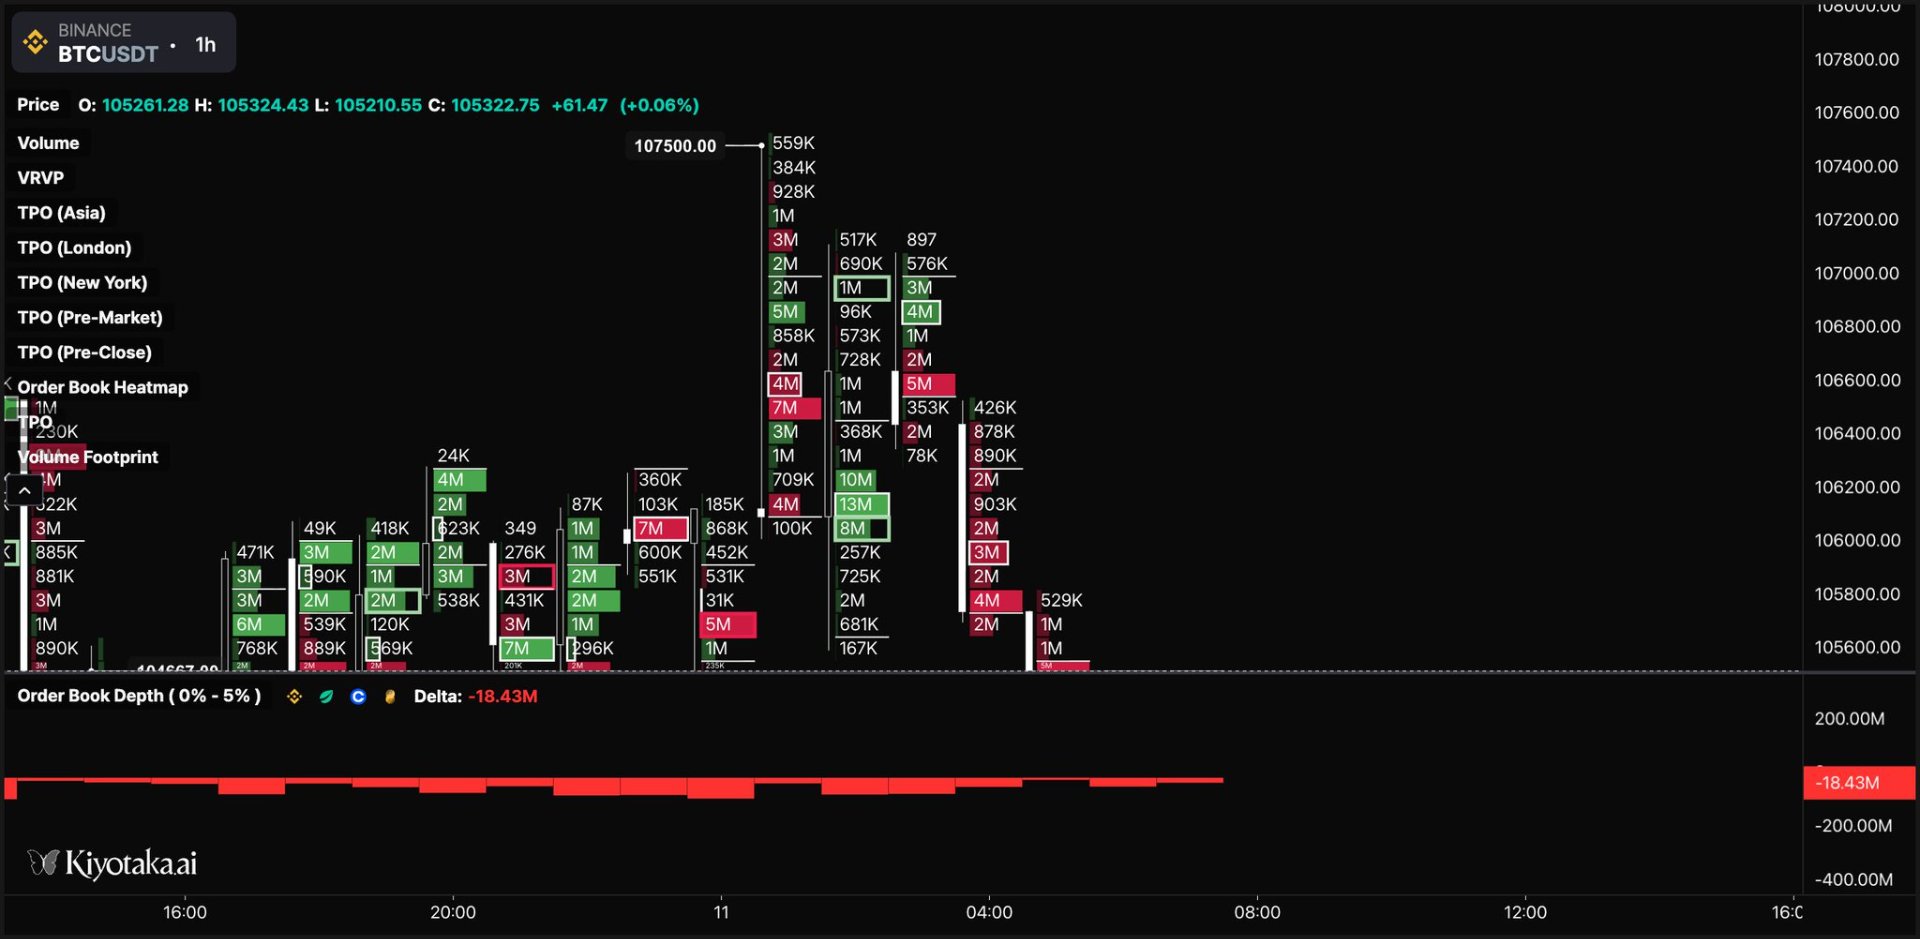
Look at the trapped longs on the top footprint. Pathetic.
- Another nice, clear tool I currently use is the volume footprint, available for free on @kiyotaka_ai. This gives me a deeper understanding of exactly how many trades have been done, and what’s the delta. In this case, we can see that volume really died off, with a delta of 500k longs that are now trapped.
Now we have a clear understanding of how the auction failed, at least for now.
Statistically, failed auction points tend to be revisited within 5-6 days. Keep it in mind, Anon.
A failed Auction Point gives us potential for continuation, so we will be looking for a close of the session below that. A first target would be below the POC.
London has a statistically high chance of following through with Asia (>75%).
Here’s London open:
Poor low sweep on London open, 11.11.2025 London Session
Again, it swept the PL that formed in the Asia session.
If you want to close your short, now’s a good moment.
4. Strategies recap.
In case you didn’t catch all of it, I explained how to trade 3 scenarios here based on today’s market behavior. I really want you to get there by yourself first, so I put the recap and the schematization here at the end so you had to actually think.
These are absolutely normal strategies, so if your IQ is above room temperature, you won’t have any problem using them now that you understand what they are based on.
I. Poor High/Low sweep: It’s in the name, if there are consistent poor highs/lows and they are still untouched, you can infer there’s a good probability they will attract price - especially with repeated PH/PL. Unless the move is supported by an auction, get out after the sweep.
II. Auction trading: I explained at length. If the auction fails, fade any new attempt, and fade into the opposite side of the IB. Conversely, if the auction succeeds, position with the direction of the trend.
III. Rotation trading: fade the extremes into the POC. It's reversion to the mean, I talked about it a lot already, especially in previous articles.
IV. The Tetris: I will talk about this in the next article, but if you check my recent posts, you'll probably understand a bit of what I'm saying.
That’s it for today. Please, like and repost if you learned something today.
Until next time.