Market Profile Series #5
This one is juicy. Today, we try to learn two more strategies that can give you an edge and anticipate tasty market moves in both directions.
0. Foreword
The strategies I highlight here are different from each other. The first one, which I call the "Tetris", is profoundly discretionary and needs to be used with the help of other signals.
The second strategy, the so-called "80% rule", is more mechanical, but you still need to exercise a degree of caution and wait for clear signs before you enter a trade. Don't come after me saying "oh but Mazino, on the 10 ticks chart we had a clear 1 print confirmation and then price moved against my position and now I'm poor".
I will Batista-bomb you, spiritually.

One print is not confirmation. It's okay to burn a few ticks of profit in exchange for a higher probability trade. You wait. The more experience, the earlier you will know where the market is going.
Godspeed.
1. The Tetris
As you should know by now, price is distributed across an interval. The "natural way" to distribute is the bell curve.
But not all the market profiles resemble a bell curve, right, Anon?
Well, that is because we have to set an interval and end the session somewhere, or we end up with huge profiles that are unreadable. Plus, humans live and behave accordingly to a daily timeframe, for the most part. But I digress.
Let's have a look at a chart, shall we?
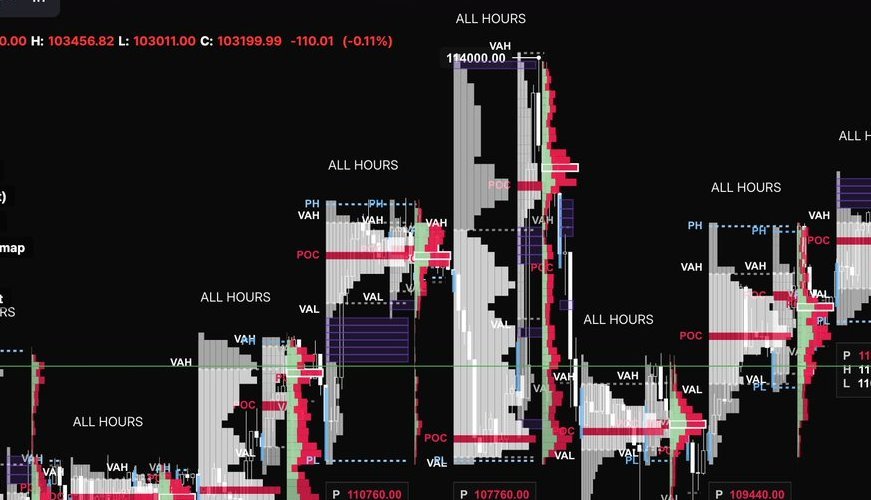
What do you see, Anon?
I intentionally didn't draw any line here, so you need to turn on your brain.
There is a "P" shaped profile, followed by a profile with a very elongated belly.
The first one showed an imbalance that ended up with sellers balancing the buyers, leaving a lot of rough terrain behind.
The second one went back down to check if there was any unfinished business there, and found plenty to be done.
Let's try again:
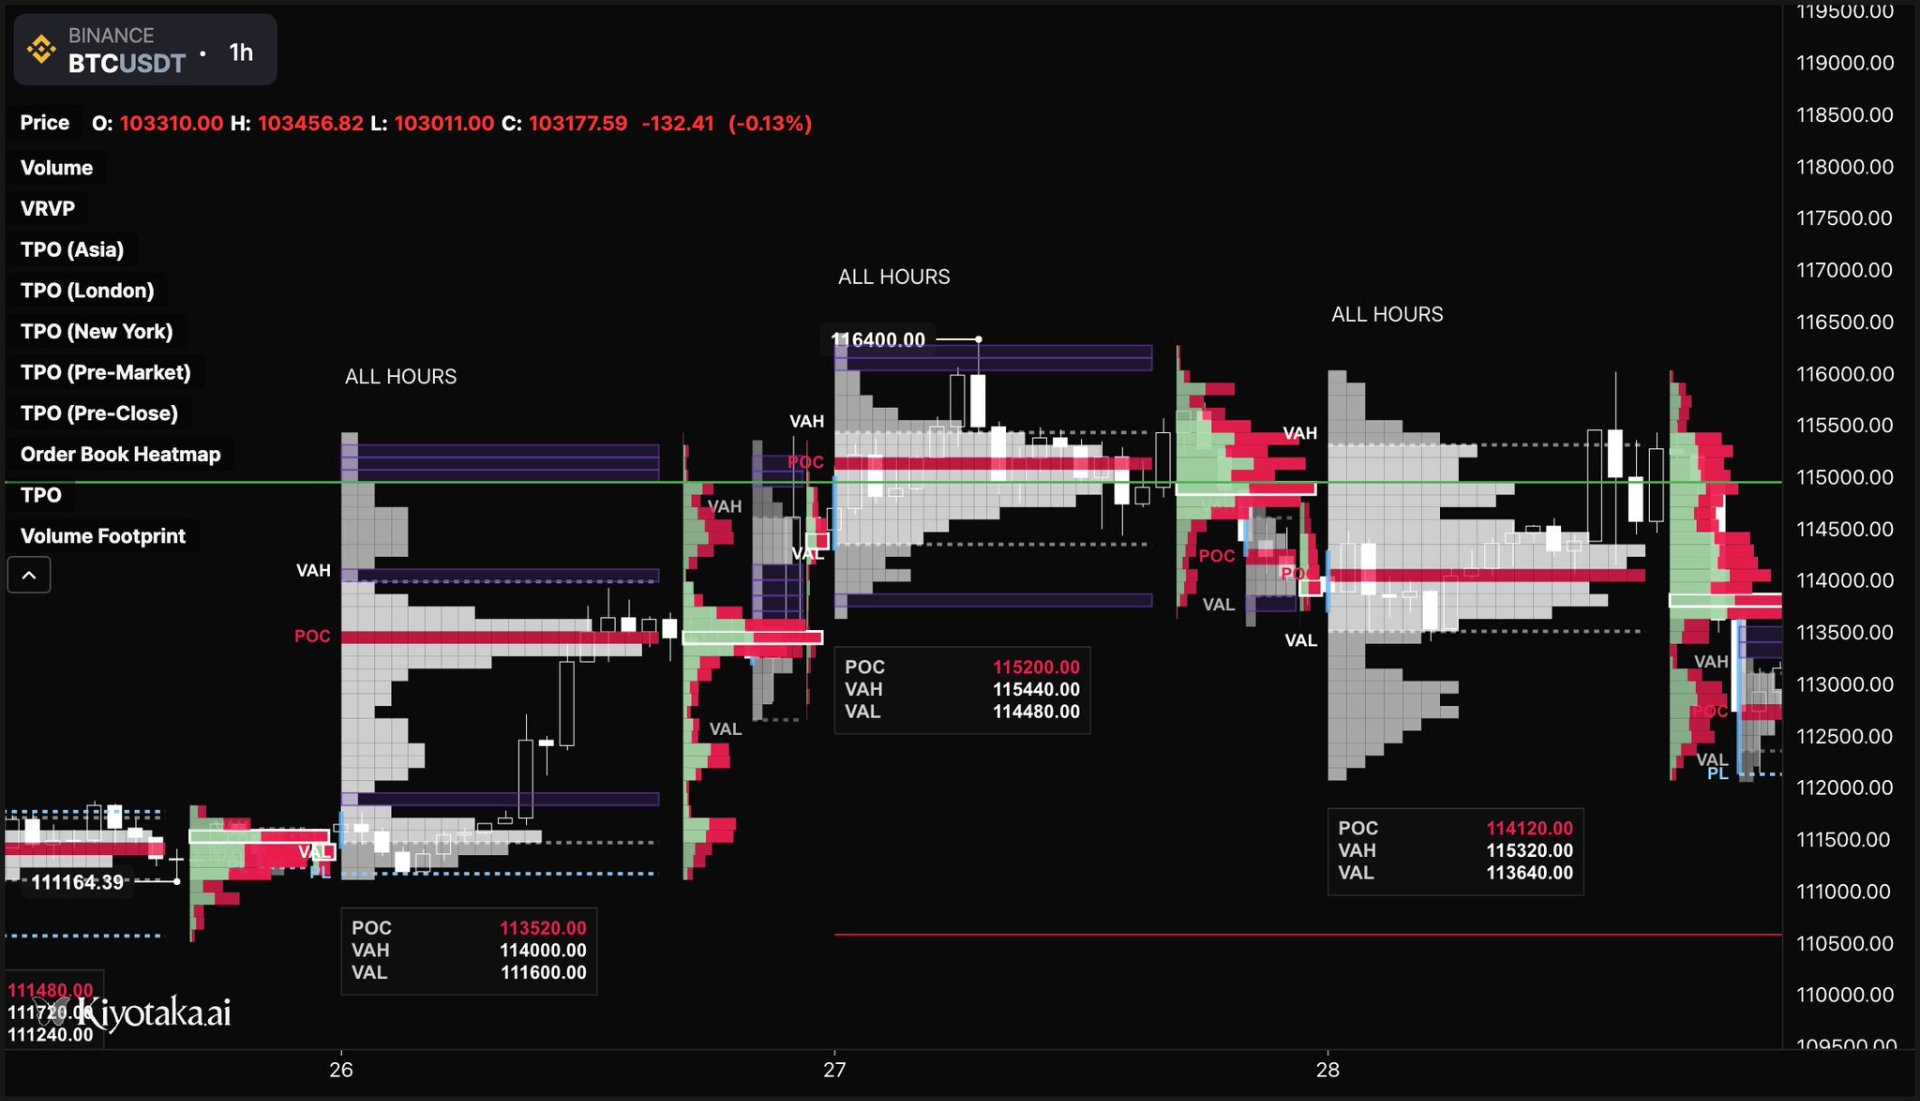
Notice something here?
This is a little less clear because it spans between 3 profiles, but you can notice that there were several imbalances in the first profile, and they were mostly filled in the following days of trading.
It's almost as if the market wanted to create a bell curve, right?
Now let me take the 10/10 event and draw some funny lines:
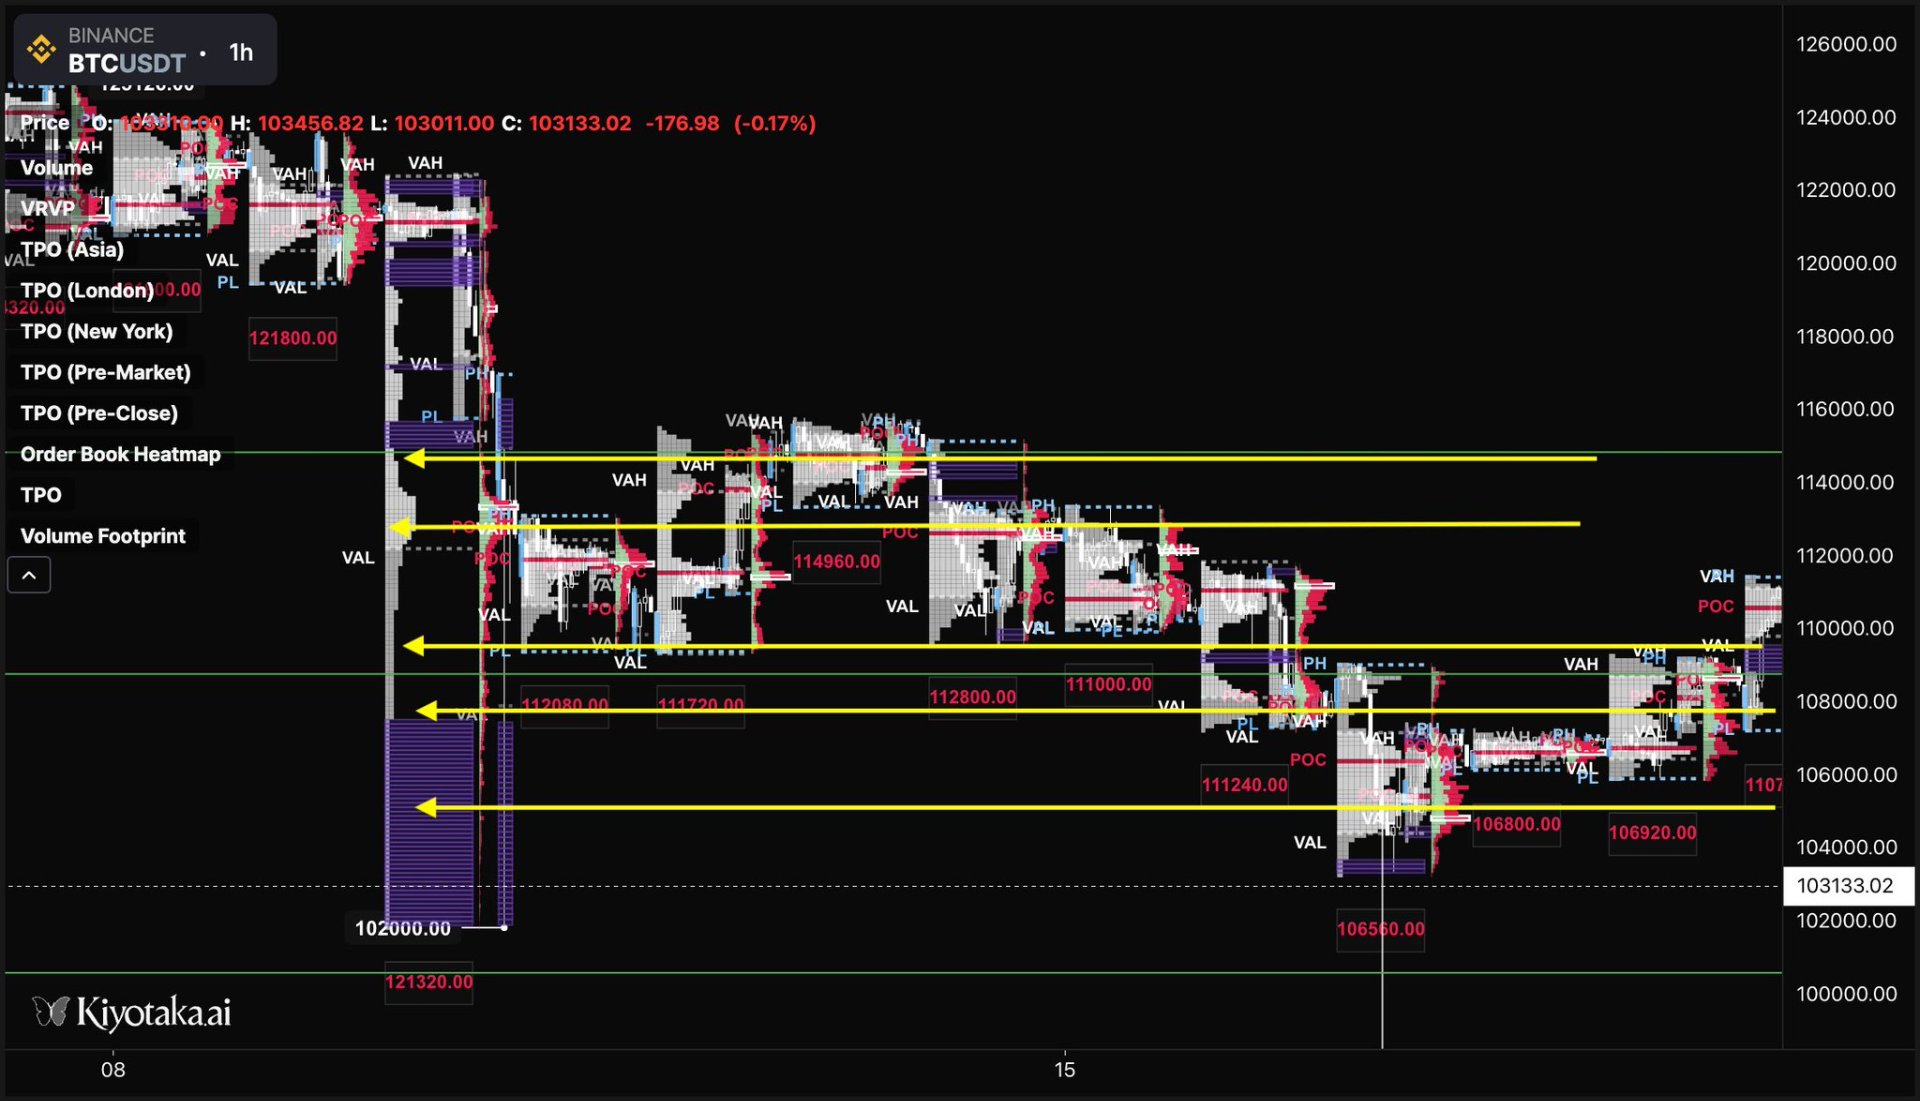
We were always meant to repair it.
We went and repaired it. That's what the market does.
You get a turbo bounce from 100k to 116k?
Prepare for blood, Anon, because we are going down there to check if any monsters are hiding in the basement.
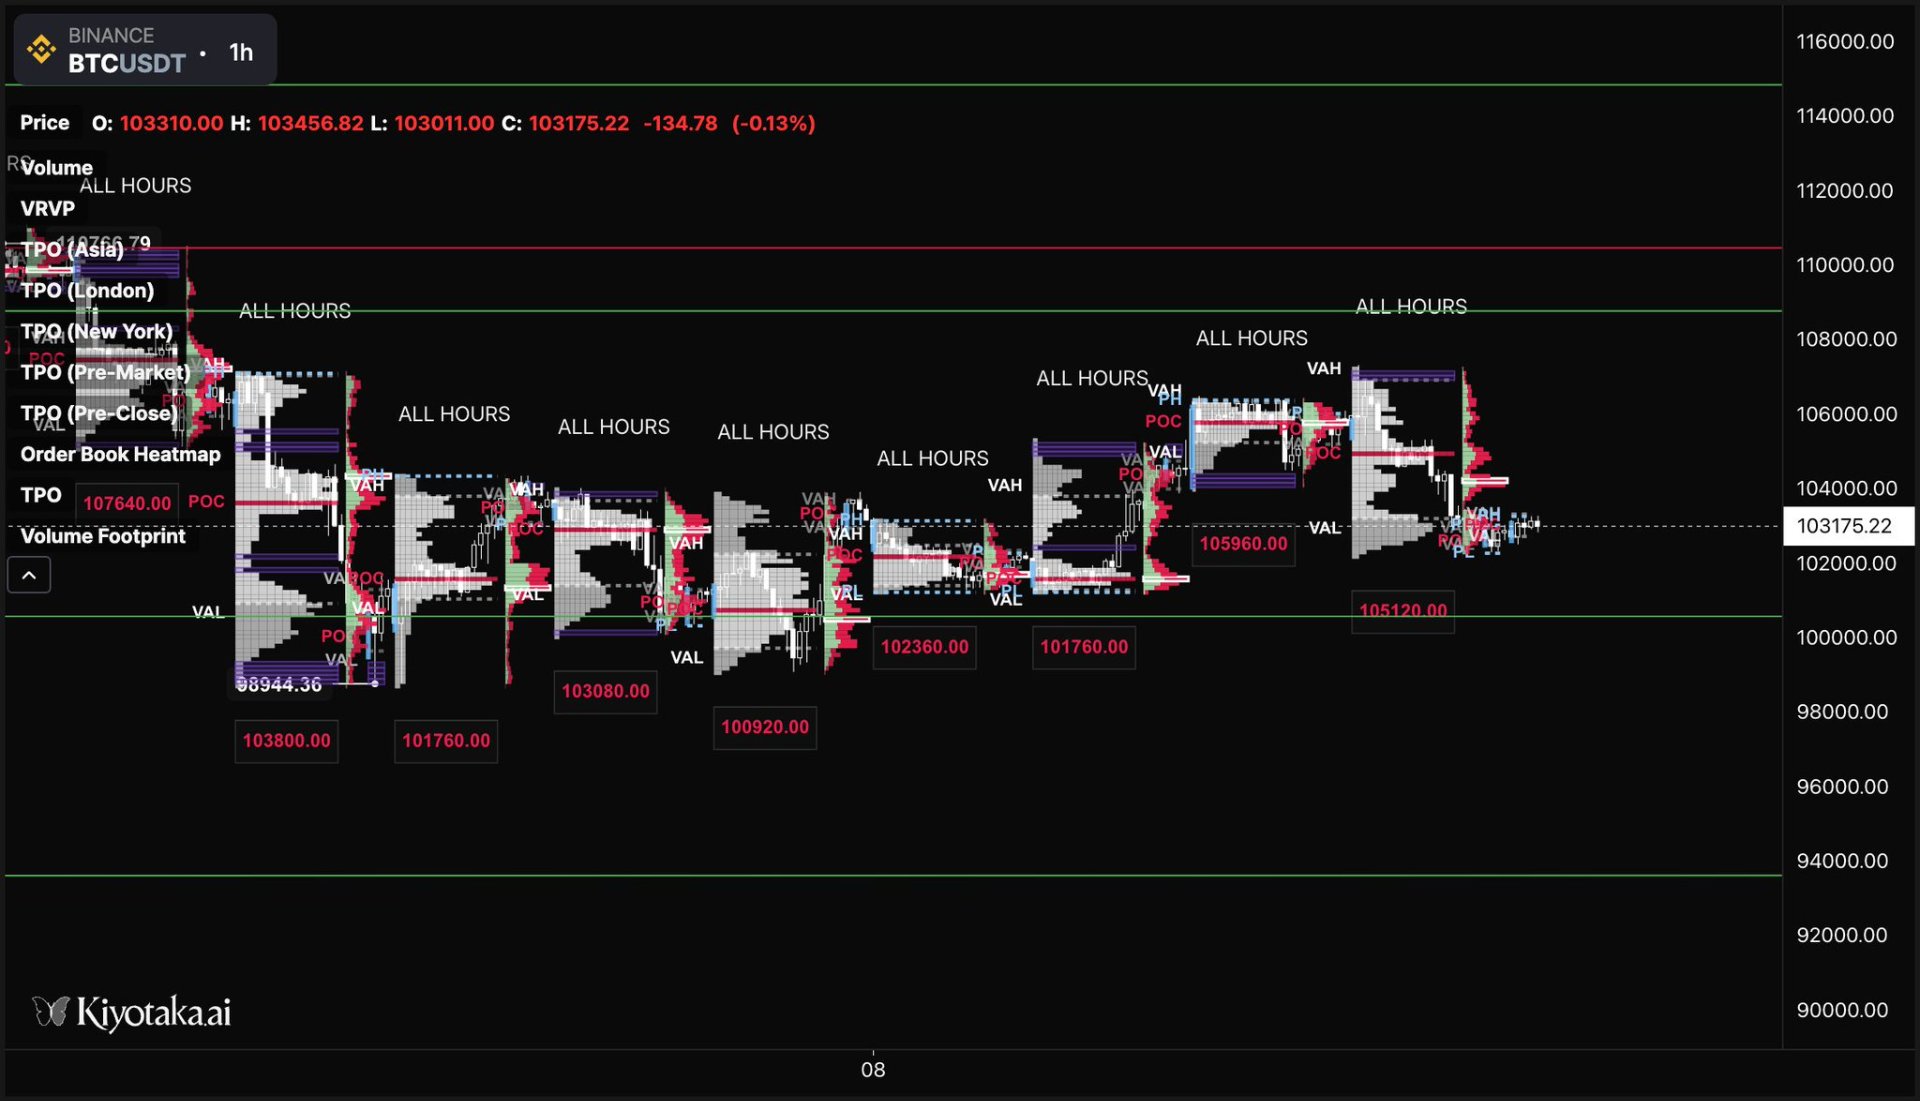
A sample profile series.
Now, all of this seems a bit tricky. Is there any way to make it easier? Yessir, there is.
We can select a profile with a right click, and select "Merge with previous profile section" to merge it - you guessed it - with the previous profile.
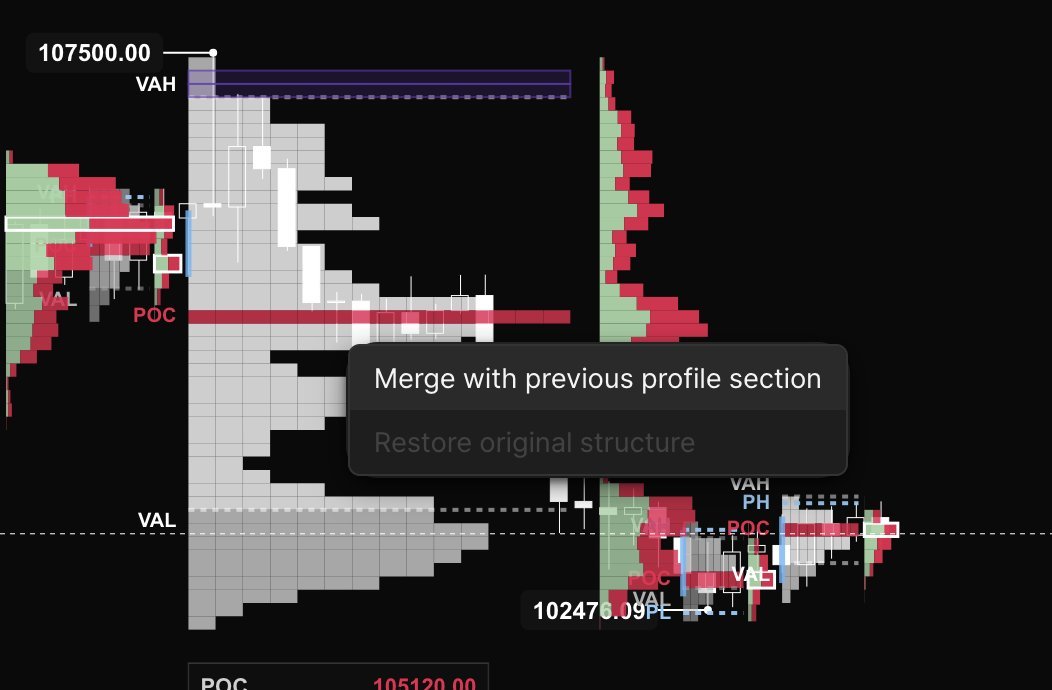
Click the button, anon.
Select the newly formed profile, click again, rinse, repeat, and you should end up with something that looks like this:
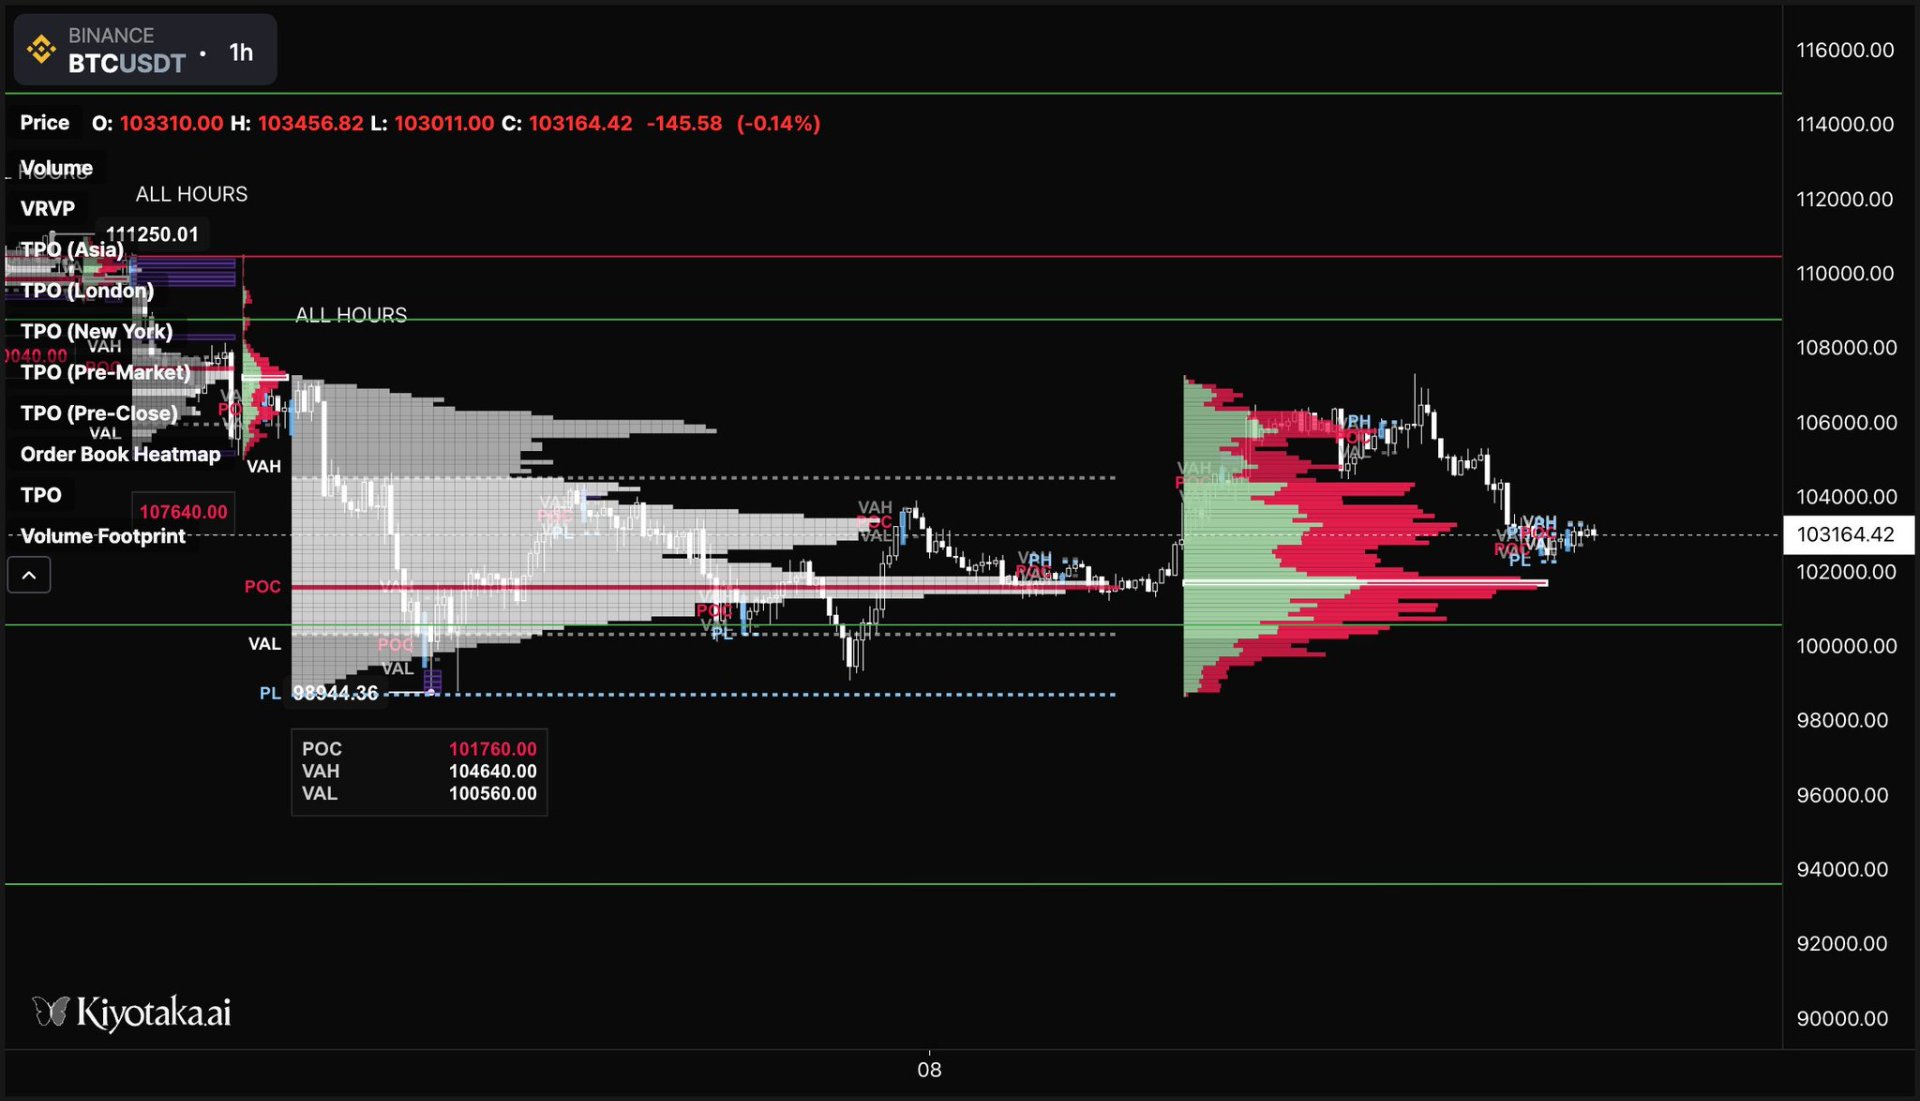
Merger of the 8 profiles listed above.
Holy sh*t! Now it's very clean, Anon! We can see that the profile resembles a bell curve much more, what now?
Well, when a merged profile looks like this, we are probably getting ready for a substantial move in a certain direction.
Also, I hope you understand that I shill
because I am a firm believer in the project, but I don't get any money from it. However, please use my reflink if you need to sign up. It's free and you can merge all the profiles you want:
https://kiyotaka.ai/ref=MAZINO
Moral of the story: you can infer where the price is attracted to. The gaps in the Tetris, so to speak. Price will fill the gaps. Position accordingly, using other things you learned to guess WHEN a certain gap will be filled.
2. The "80% Rule".
This is much simpler in theory and more mechanical.
We learned about the Value Area (VA), Value Area Highs and Lows (VAH/VAL), now we learn how to make use of those for a probabilistic setup.
The rule is the following: When a day opens outside of the previous day's value area, and the price is then accepted back into the value area, there is 80% chance we are going to trade to the other side of the previous day value area.
Seems easy, but let's look at some tricky examples.
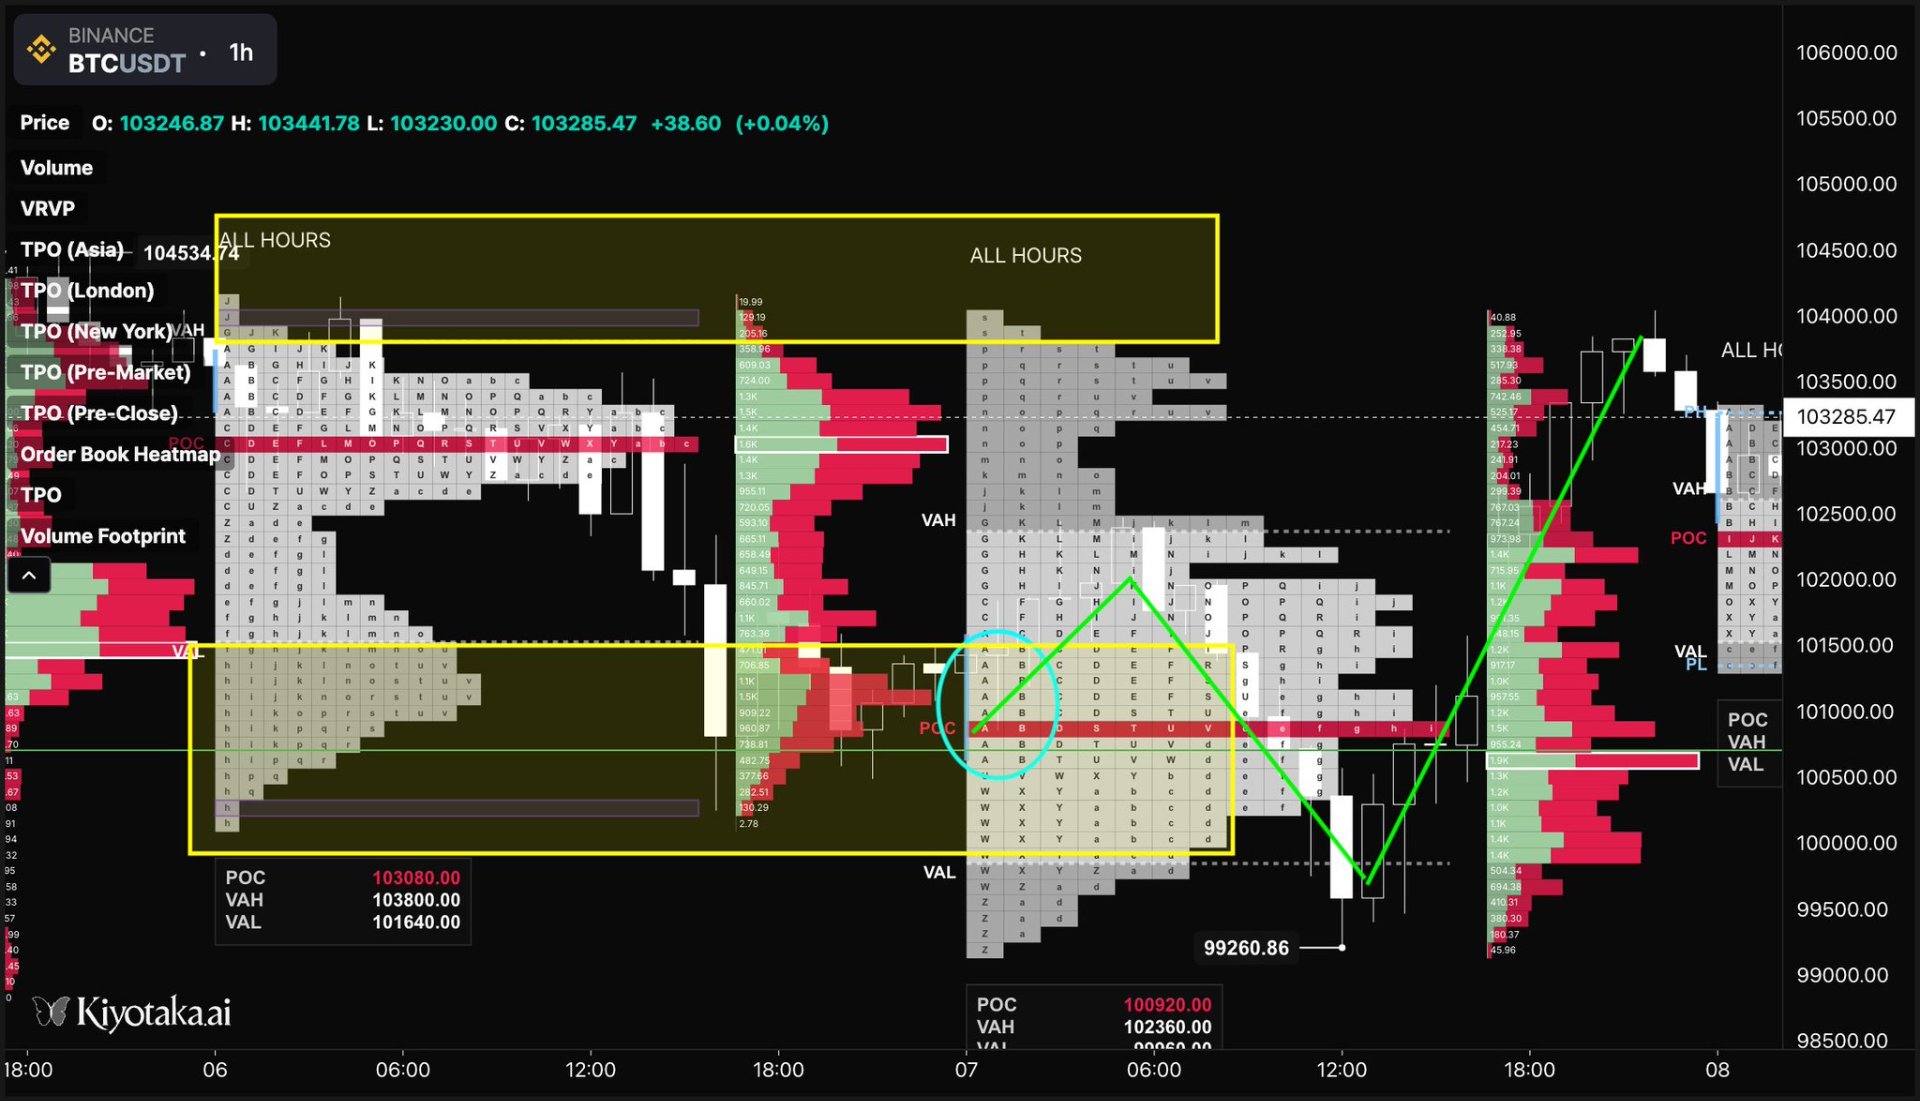
Example of the 80% rule.
The price opens (blue circle, IB) outside the pdVA and into the pdVAL (bottom yellow box), drives into the pdVA a first time, and after testing a new low, it slowly grinds up to the pdVAH (upper yellow box). I highlighted the trend with a green line.
I picked this example to show you that things in real life are not always as smooth as in theory. Price seldom moves in a straight line, and if you don't wait for confirmation (more on this in the next article) you might end up stopped out even with a stop loss below pdVAL/VAH.
Another example:
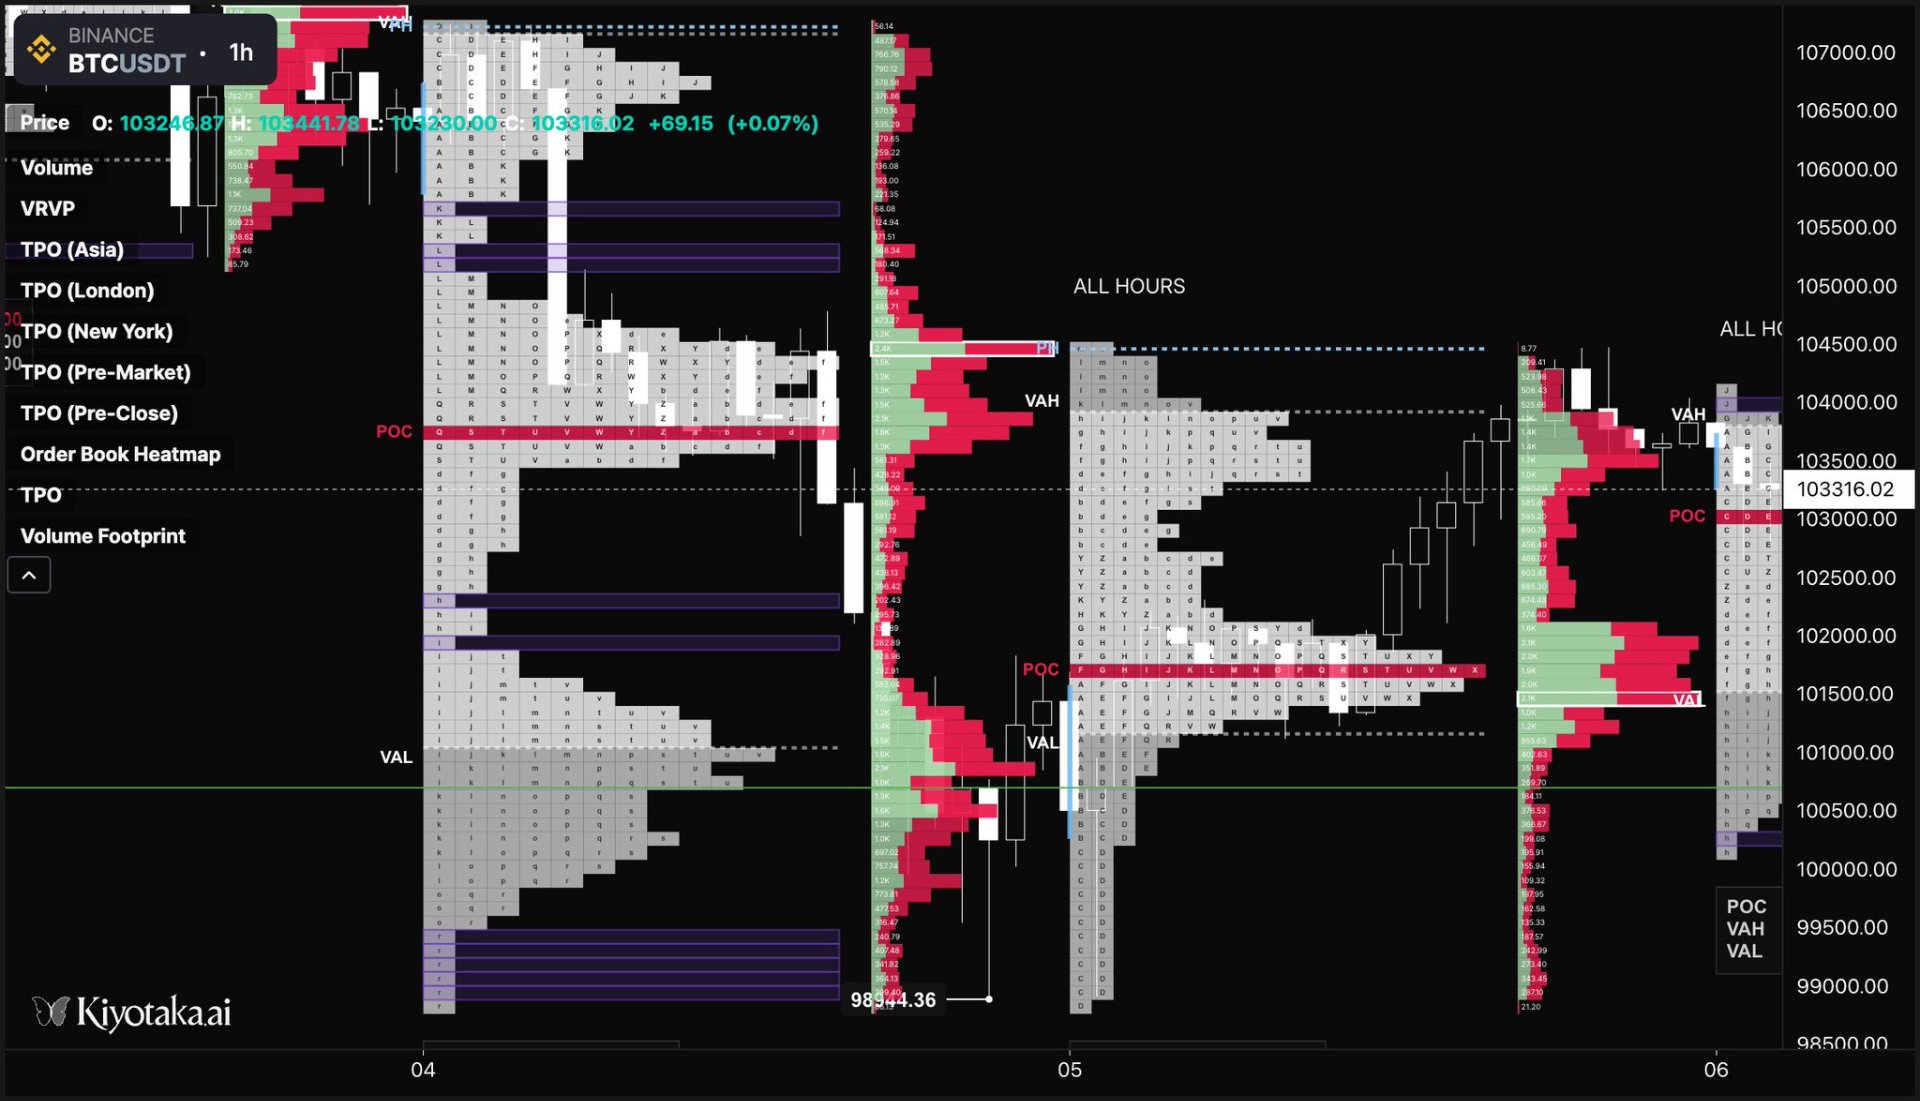
That's right, a triple distribution.
"But Mazino, you said the rule trades into the opposite end of the VA".
I say many things. For example, I said that in a double distribution profile, we treat each distribution as a separate day. A triple distribution profile - like the one above on the left - is no different. We treat each distribution as a separate day.
As you can see, the reasonable target is much lower than a pdVAH in this case, but you can eyeball a VAH for the middle distribution (top 15%) and see that price ends up just at the same level.
Try both strategies with very small amounts to get comfortable with them before doing degenerate leverage perp stuff.
That's it for today.
Until next time.