Market Profile Series #6
This article and the next few ones are probably the most important in the Market Profile series. These will make or break you.
0. Foreword
If you’ve read my previous articles, you know that my guides are not spoon-feeding information. You will rarely find a “do X and Y” statement.
I won't do it for your own good. I cannot manage your trades and I don't want to be responsible for your money as well. I hope you understand this part.
If you want that stuff, follow some other donkeys that will tell you "ATH in 15 days from today". I'll be laughing hysterically while you get rekt again.
If I trade something, you'll most likely see my plan in advance, my criteria for the entry, my entry, and my close. I make mistakes too. So you will know about those as well.
I want you to actively use your brain. As the market evolves, strategies expire. If you master the concepts and actually learn something, you can come up with your own strategies, adapt, and survive another day in this asylum.
I’m sure I weeded out a large part of normies with my previous articles. Just because I explain complicated stuff in simple terms, it doesn’t mean this stuff is easy.
And sure as hell, I cannot make it easier for you.
If you want to be placed in that top percentile (<10%) of traders who profit from the market, you need to know the rules of the game.
How hard do you want to be successful at this? Turn your brain on.
Commit. Be disciplined.
This shit has to become boring for you to make money. I got back on X because I'm f*cking bored.
Today we leave patterns and strategies behind and start looking at a more foundational approach. Learn the things that make you money.
1. Context is key.
All the stuff you've learned so far is useless if you cannot contextualize.
How do we know if the "P" shape is a short covering or if a "b" shape is a long liquidation and not some other fuckery? How do we know if a poor low will be taken out later during the day?
We need to understand context first.
I organize this through steps, and I go over it every damn weekend while I prepare for the week ahead. It take less than 1 hour and gives you incredible edge.
The steps are the following: Market conditions, key levels, previous week.
A) Market conditions.
So you go to the candlestick chart and have a hard look at the market on the weekly.
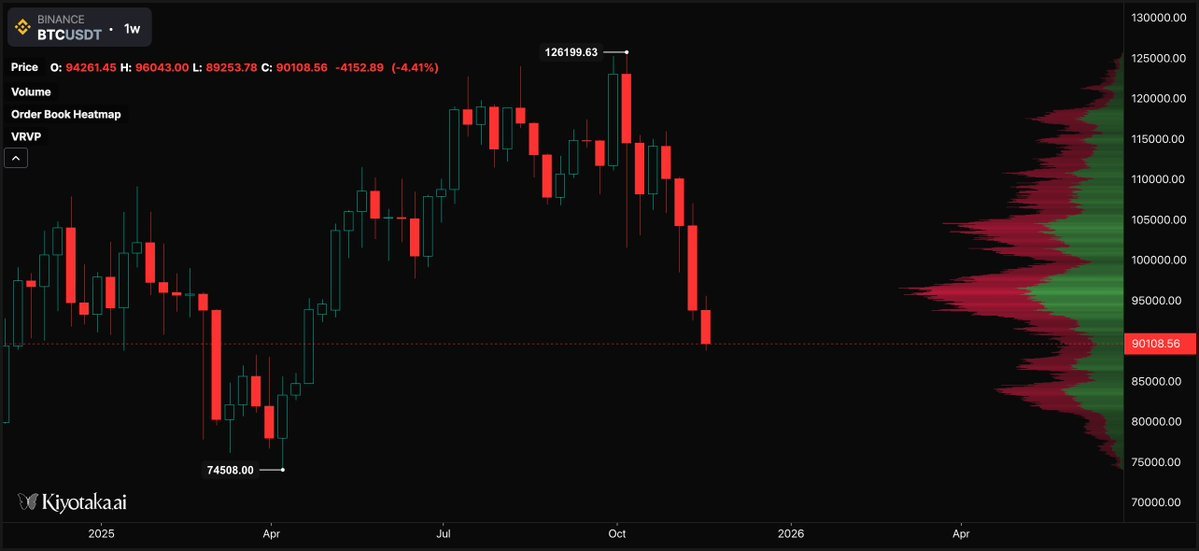
The weekly candle chart.
Where is the market going? IT IS GOING DOWN.
So chances are we are statistically going to go down more.
"Oh, BuT wHat iF tHe MaRkeT rEveRses?"
Since 2019 market reversed trend 9 times. That's 9 times out of 2513 days. Don't expect generational longs in a downtrend. You won't catch the bottom.
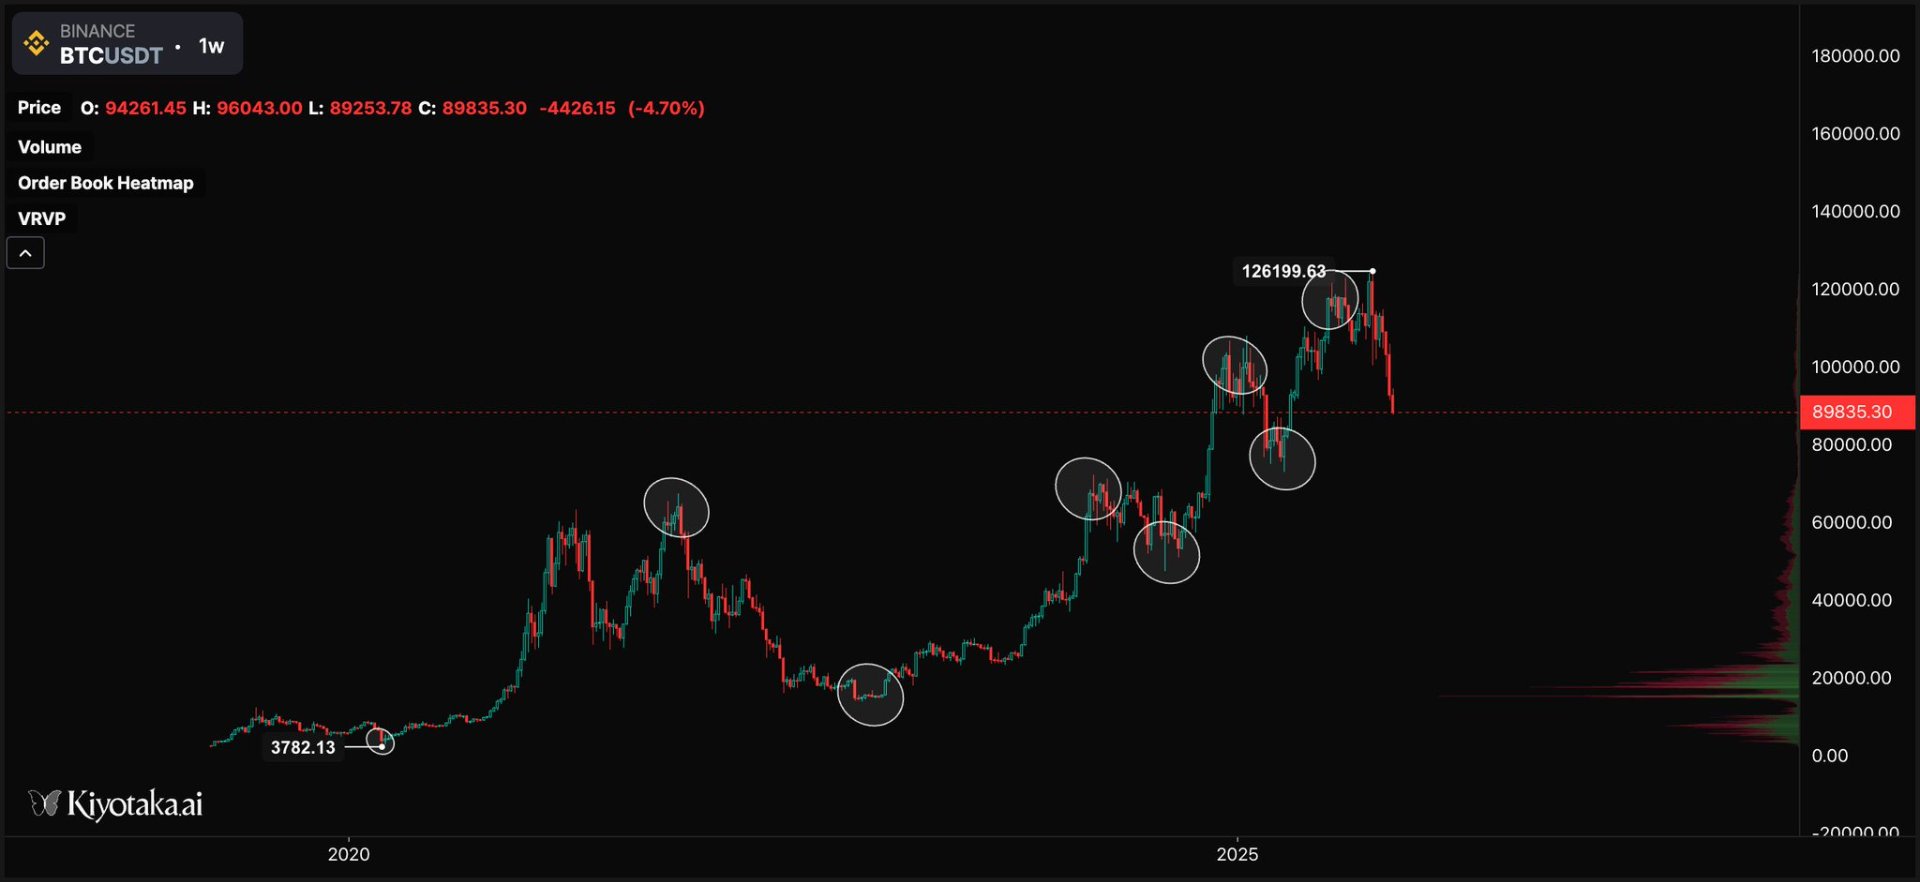
Here's the trend reversals. 0.36% chance of reverting in the last 6 years.
Ok, now we know that we have a downtrend.
b) Key levels.
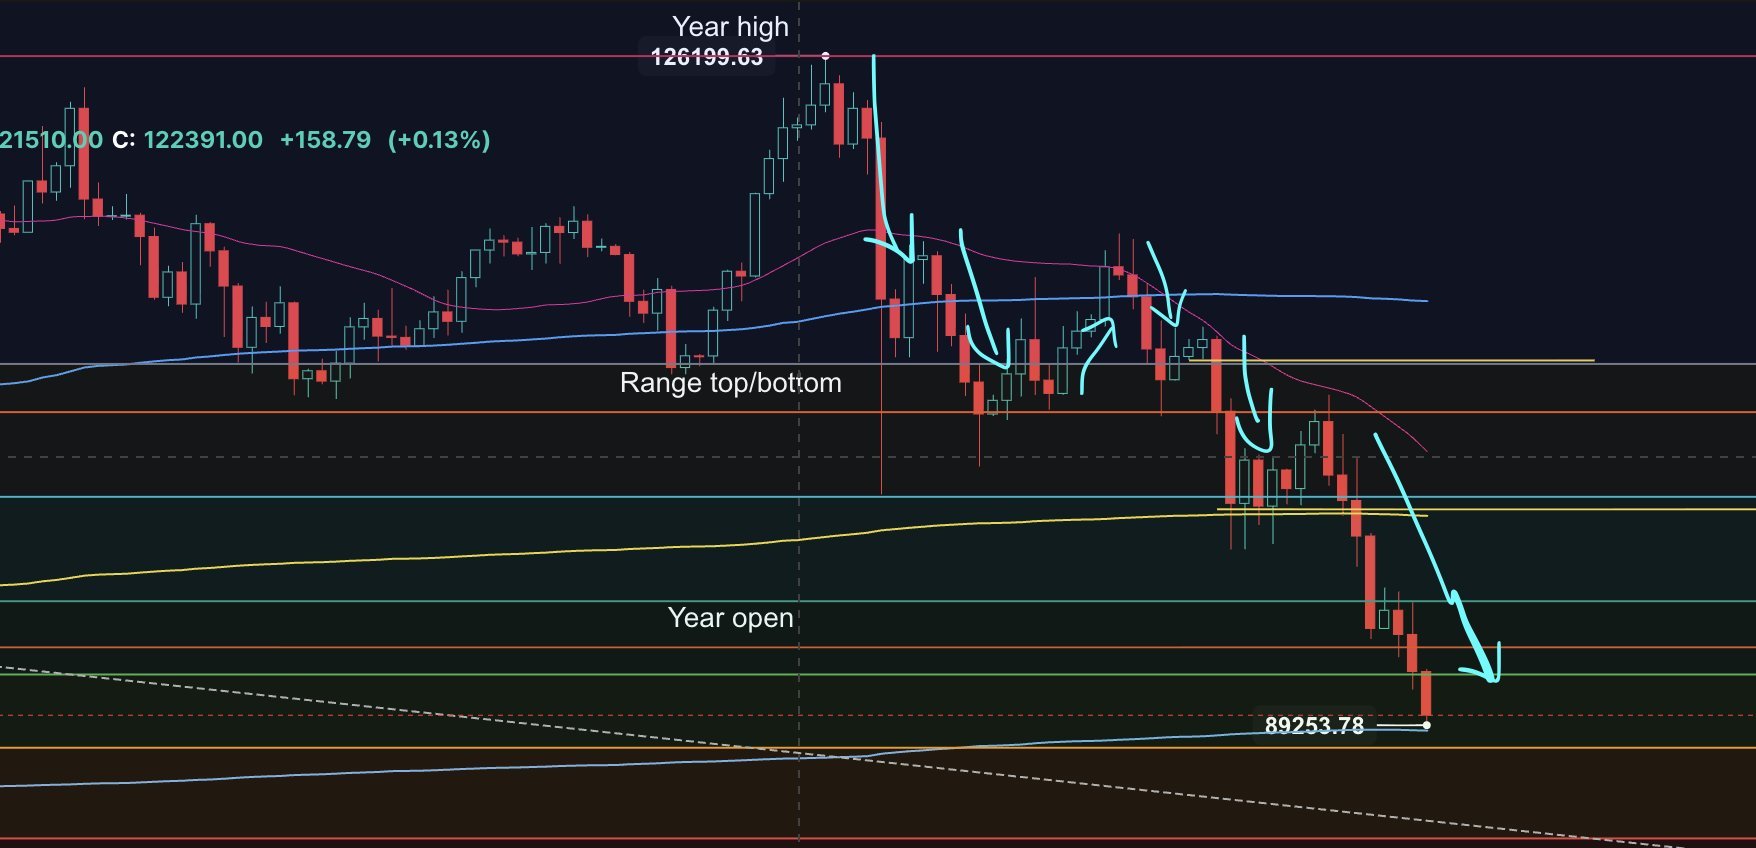
You take a line tool and start looking for yearly open, yearly low, yearly high, and the most recent range line. Then you open indicators and set a yearly anchored WVAP (you do it in the WVAP settings), SMA, SMA 200, and an EMA.
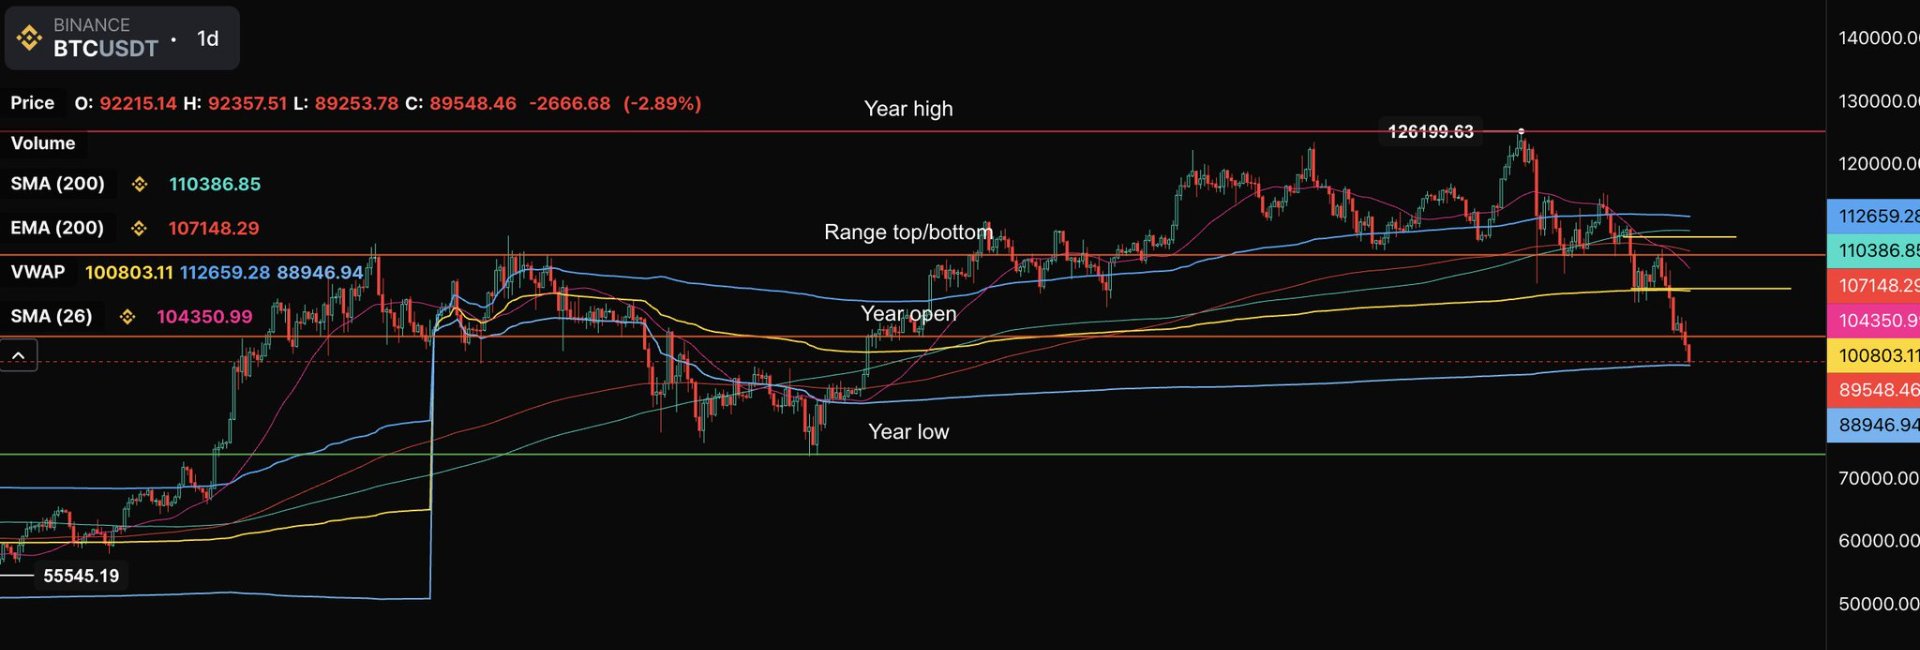
It's going to look like this.
Here's the link for this so you can copy: https://chart.kiyotaka.ai/g3u1WJJF
Those are the key levels. Every time we approach them there is a chance for reversal - 0.36% chance. But there is a much higher chance for the price to bounce around them for a while because they are psychological barriers.
If you're feeling fancy, you can also drop a Fibonacci retracement on last year's top to the following bottom. Add more key levels, increase diff.
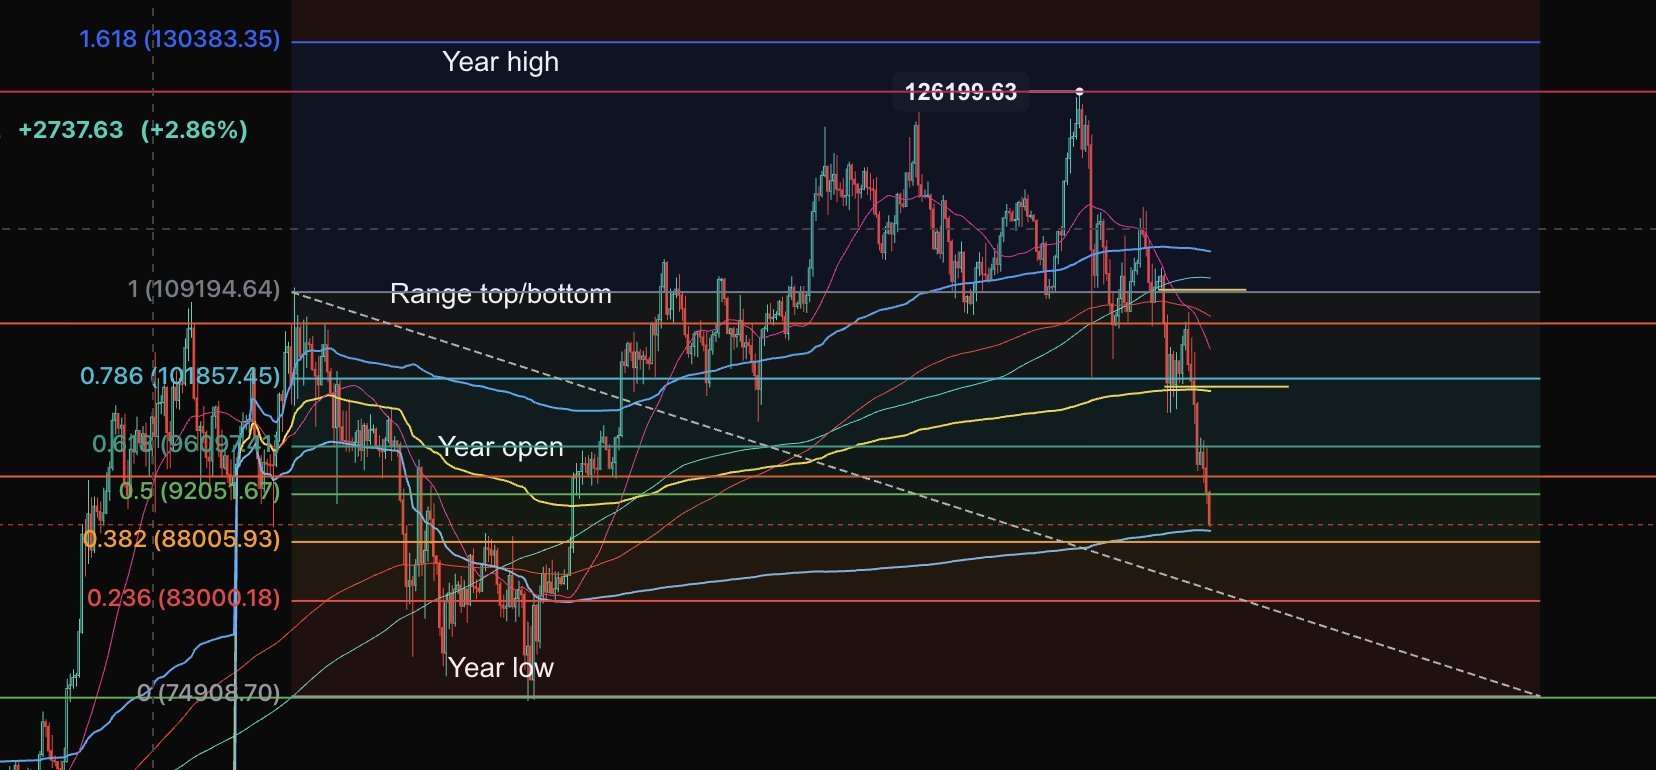
Fibonacci black magic.
Price will do two things around these key levels. If algos and regular traders are in control of the market - e.g., the whales aren't interested - price is likely to bounce or mess around that area for a while before piercing through.
This is because generally many participants will be positioned short arriving to those levels, and will take it as a chance to rebalance inventory. Others will take the chance to long and so on.
The second scenario is price spearing through like those levels do not exist. It is a rare occurrence, and it means a large market participant (a whale) decided to sell into those levels to buy cheaper later.
So what do we do when we approach those levels? We look for continuation.
I will talk about this in details later.
C) Previous week. This one is easy.
How does the value look? Is it going down? Look at the value areas and ignore the weekend.
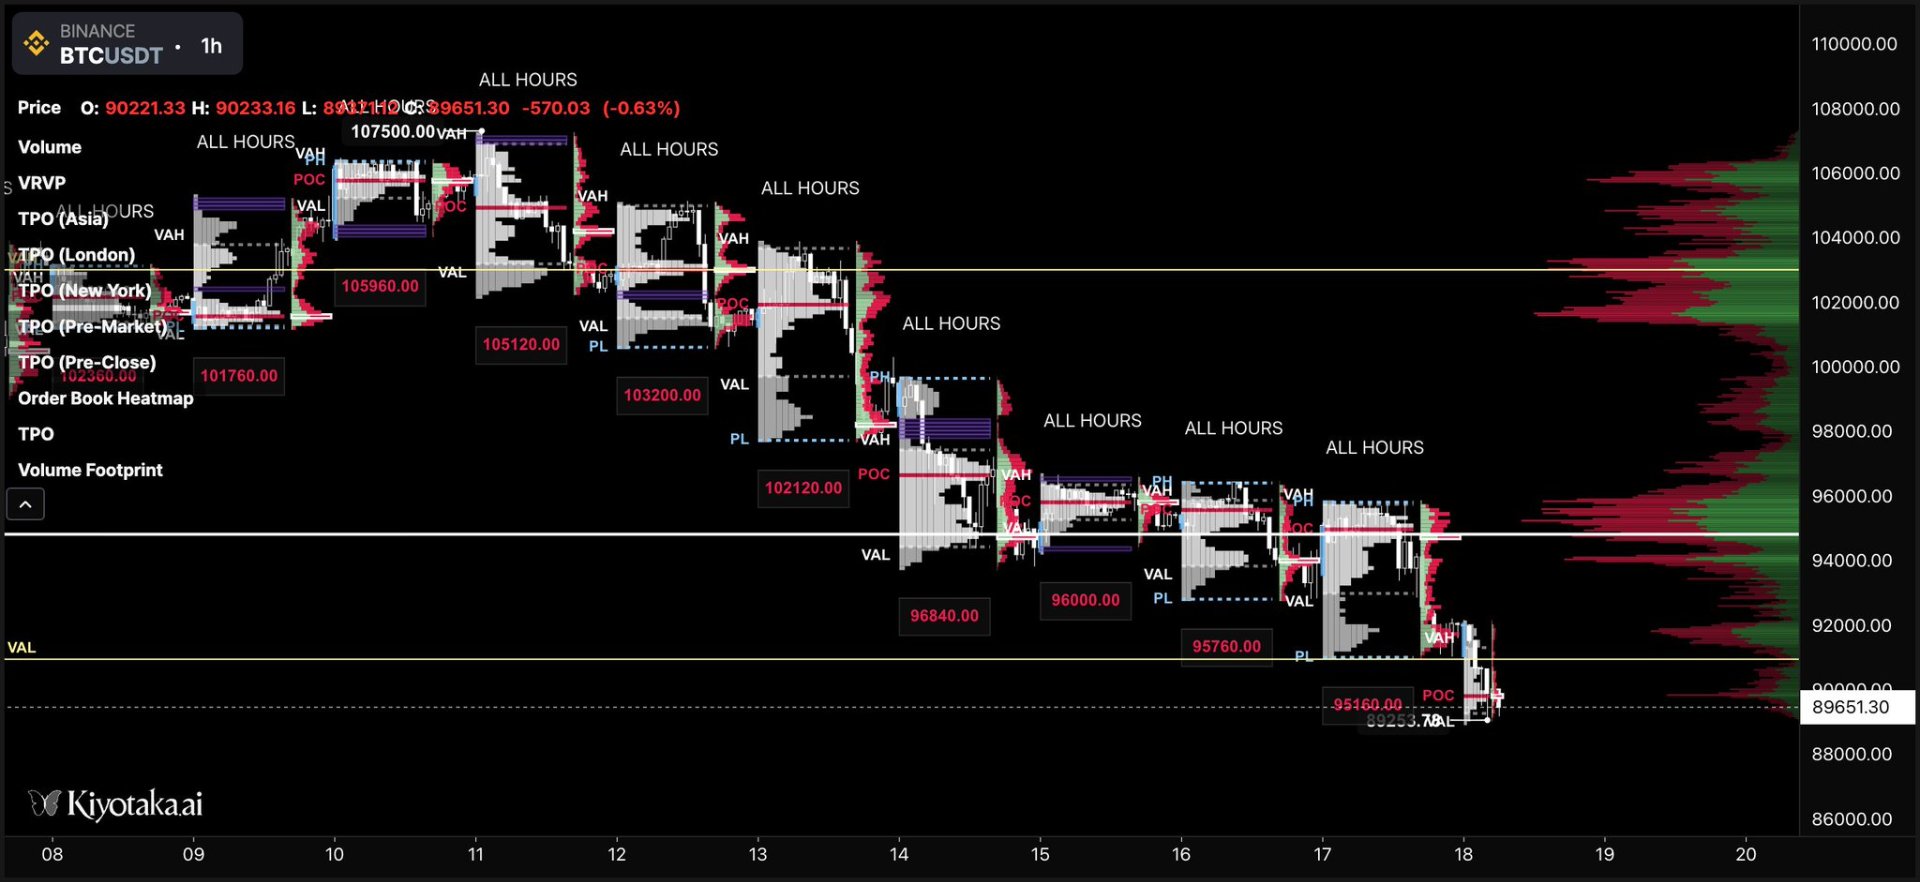
Value areas are lower, so unless we have a strong signal of reversal, bias is unchanged.
Assume the trend is unchanged.
It doesn't mean we can go long, just know that longs have a limited risk/reward ratio, and you have to get in and out fairly quickly (normally within the session). For example, use the 80% rule to catch a bounce if the market signals some momentary strength.
Now you have your targets. Price in between has high chances of trending.
Look at the chart again. Prices moves (trends) between known reference points because we are monkeys and we like patterns. Use psychology in your favor. Some are hard (yearly open), some are soft (fibs).
2. Tempo
Tempo can be defined as the speed of price change. It doesn't mean volatility. Think more of conviction. Price tends to lose tempo when it approaches known levels, and to accelerate when it goes through unknown levels.
Imagine you're walking alone at night, in an area of the city you aren't familiar with. You'd probably be uncomfortable and want to reach the area you are familiar with as quickly as possible. Your pace will slow down once you get there. Price acts in a similar fashion.
The same happens above ATH, because participants are euphoric. Imagine being at a buffet when you are starving. You'll just fill your plate with stuff you wouldn't normally eat. At home, you would be much more mindful of what you are eating.
I talked about b and P shapes before. Well, what does a b shape mean in the context of a downtrend approaching a key level? Long liquidations?
In that case, be mindful that the market needs a break before it can run again. Inventory needs to be rebalanced. Then we can proceed further.
The opposite is true for the P shapes in a bull market: short covering.
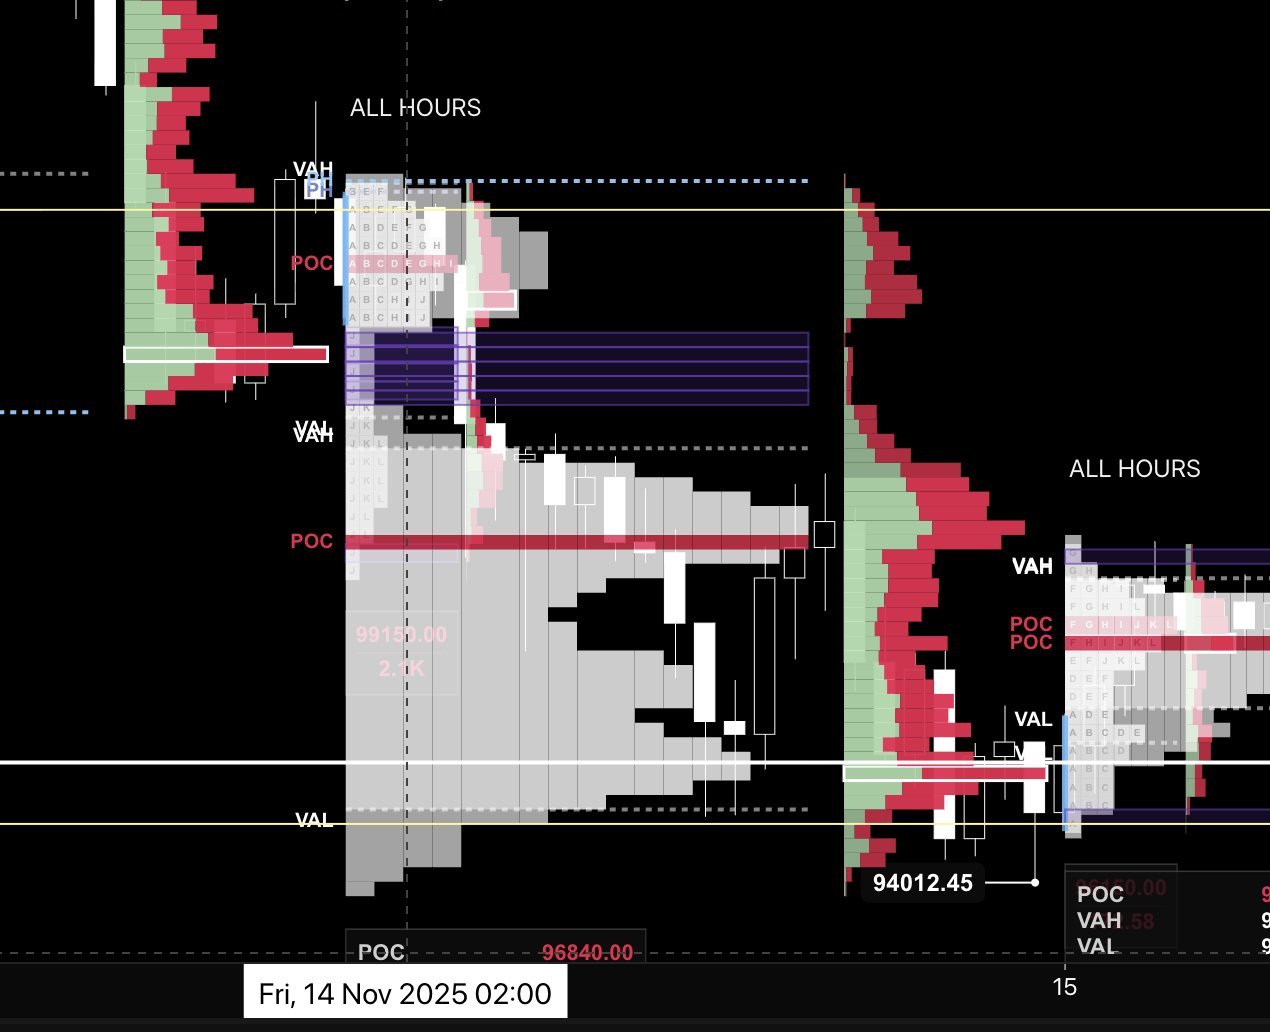
Long liquidations.
Now don't get fooled because sometimes a daily profile can show a P shape in a downtrend. The belly formed first, and the "leg of the P" formed afterwards, so it is not applicable. For short covering/long liquidations, the bellies for last. But how does that P shape work in a downtrend then?
An uncertain market with slow tempo has more of a "squeezed D" shape, with no tails.
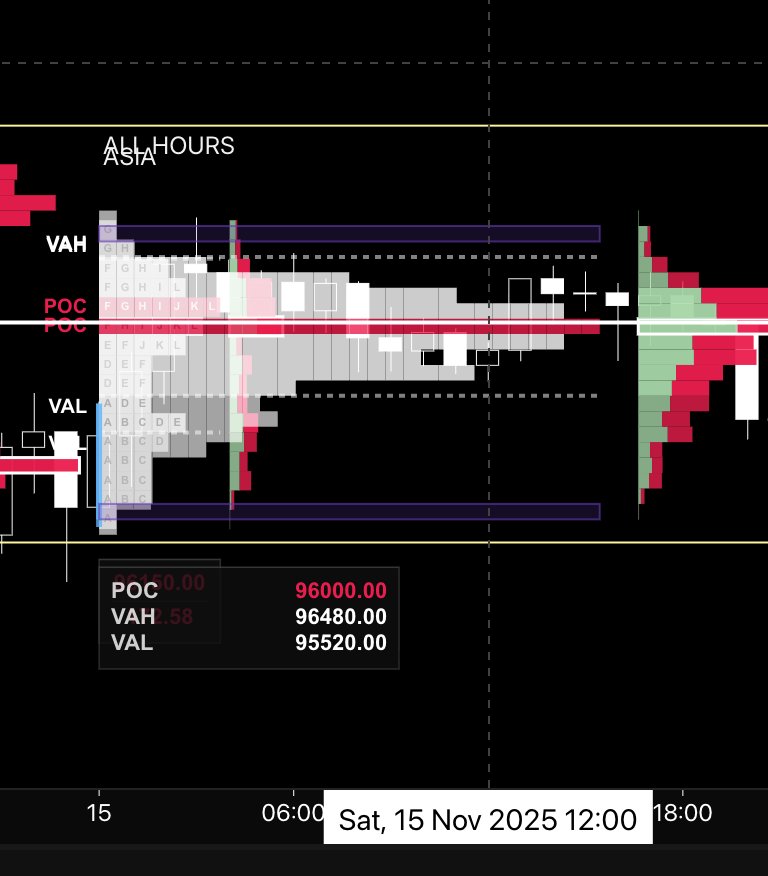
Squeezed profile
If we look at the profile from Saturday, 15th, 2025, we can anticipate that participants are in a tight spot. No tails are formed, and we know by now that this is an inefficiency, and a move is to be anticipated. A rip during the following session (or sessions) is possible
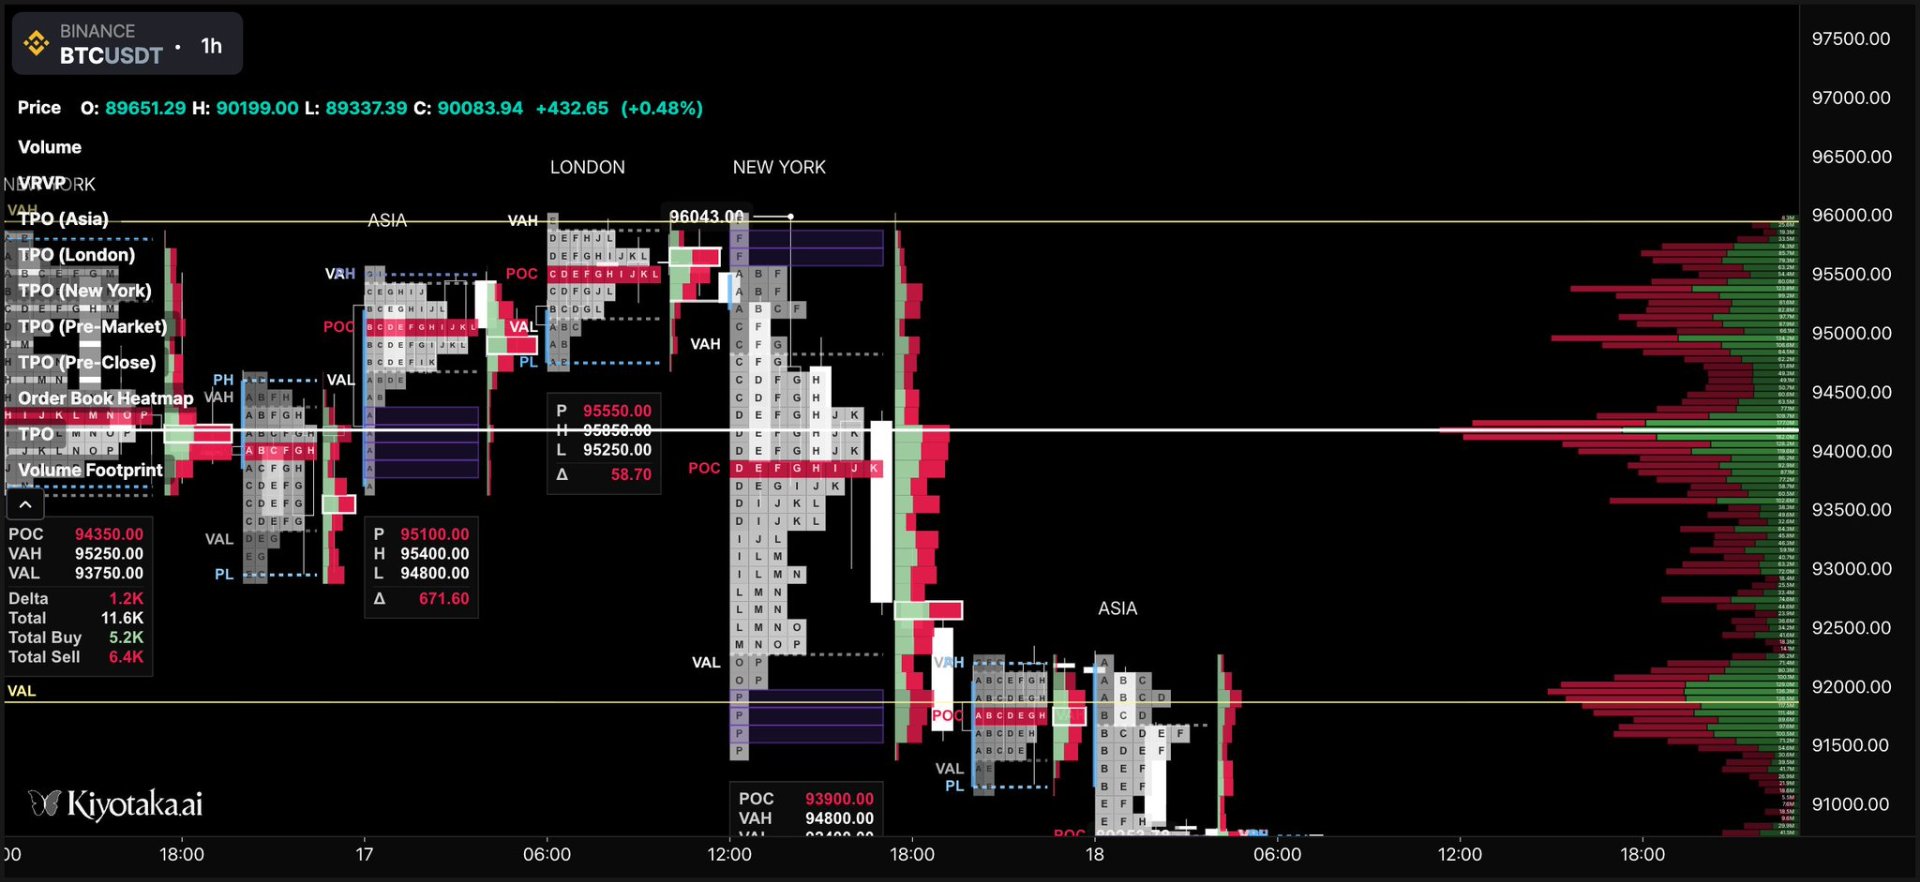
Now let's look at the following Monday, 17th.
We know that market participants were tightly positioned from Saturday, and some probably went short on the following Sunday.
Asia opens and quickly jumps up in price, pushing shorts to close their positions - but there isn't much business to be done. No more longs to be opened. See how sluggish London looks?
They were all long already! Market was too long to long any further!
How do I know this? @kiyotaka_ai has a nice little indicator called "Margin Long Short Ratio". Another one is the aggregated liquidations.
In the chart below I set them both under the candlestick chart: Long short ratio above and Agg. Liq below. Look at those donkeys, they were all long and got liquidated when price broke.
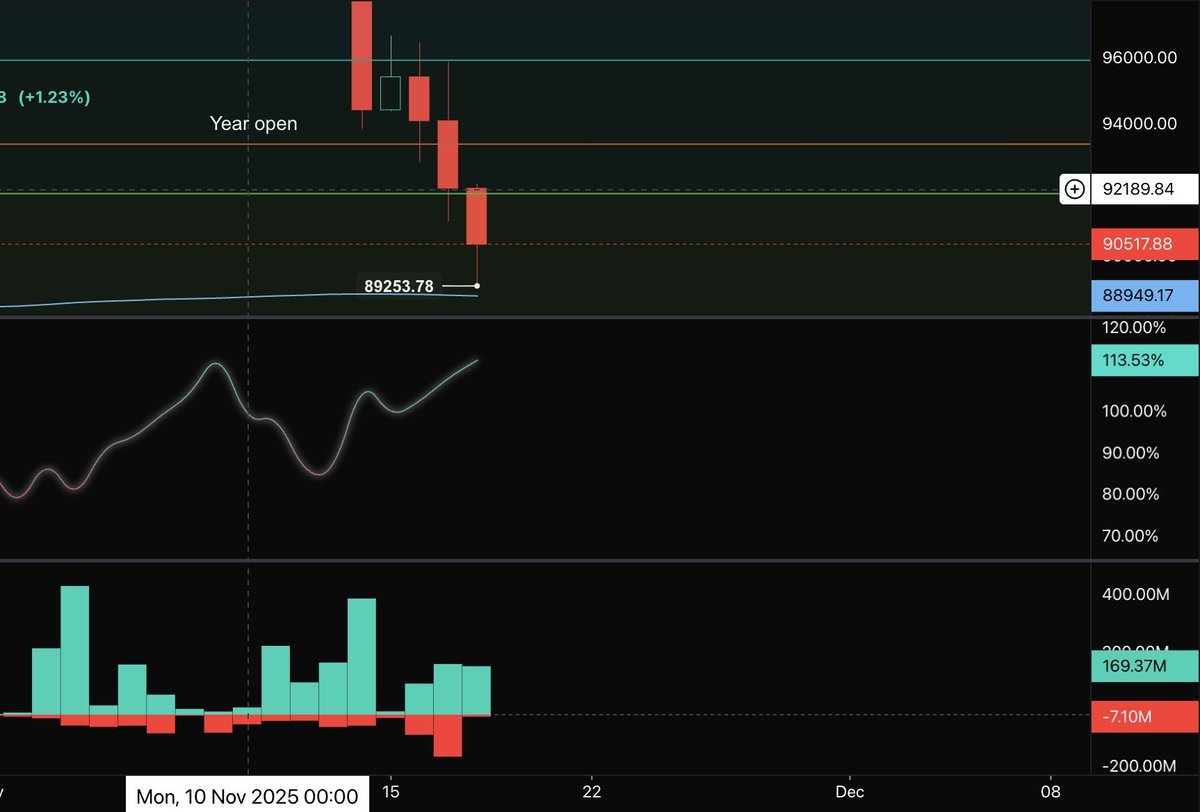
REKT X-ray
Price starts accelerating, tempo up! If you paid attention to my posts (https://x.com/crypto_mazino/status/1990536286546117024?s=20), I shorted the NY, and took profits heading into the pre-close because tempo was decreasing - see the buying tail, market too short now! Normal were in control of this.
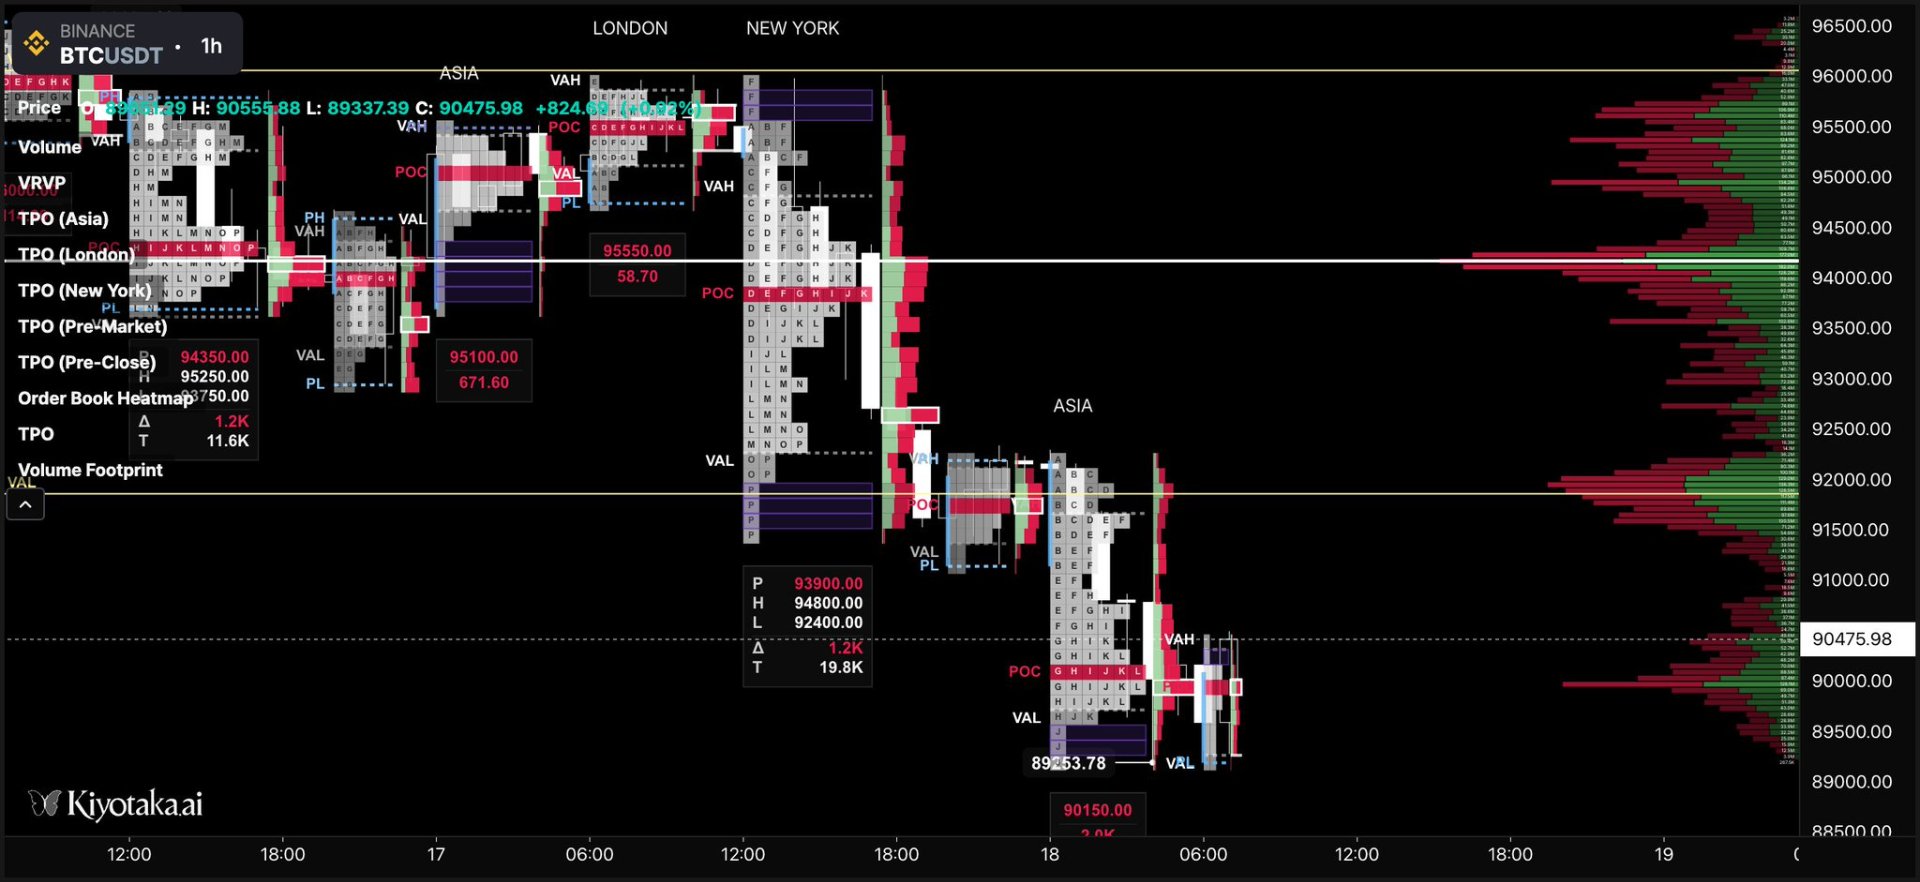
Then I speculated on both scenarios again for today Nov 18th, long or short? Long for a scalp is VA was regained, otherwise short to the next level. Post for reference: https://x.com/crypto_mazino/status/1990610240010879087?s=20
VA lost, tempo buildup, down we go to the next key level. Funny thing.
3. What the hell is going on?
Well, I know it's confusing, but you need to think in market and value terms here, not just price action. How's the market positioned? The longs liquidations are just buy orders for someone who's short.
If you adopt this perspective, you have a broader understanding of liquidity, and of possible value migration. Long liquidations momentarily slow down the market - we need to fill those, and then we need someone else to open another long position for us to go lower.
Reverse for uptrend.
That's a slowdown in tempo. When the market has rebalanced, we can proceed further. Contraction, expansion. Market breathes.
Y'all focus too much on reversals, like it was some magical moment for you to make money. It isn't. The trend is your friend. If you position with the trend, then you are already moving in the right direction. Use contractions (bellies) to position, and move in the direction when tempo speeds up.
It's easier said than done, but if you grasp this concept and then interpret what you've read so far with it in mind, then you will start understanding confirmations, targets, and entries.
More complicated stuff in the next articles.
Recommended playlist for trading, sinthwave:
Until next time.