Order flow & Footprint Series #2
Busiest week of my year but I made it, the article is out.
0. Foreword
This isn't my longest article to date, but I'm happy I finished it within the estimated time. Only a few concepts, but extremely useful ones. I made a small mistake yesterday, which is good news for you so you can learn from my mistakes instead of your own. I'm saving you a few bucks here.
Let's analyze it and learn something about a useful indicator for Order Flow.
1. Market structure
Let's start by looking at the most recent price drop in $btc.
We had some flat days over the weekend, and money just didn't really flow in. As you know by now, we should have a clear bias relative to the market trend, and at the moment, the trend is bearish.
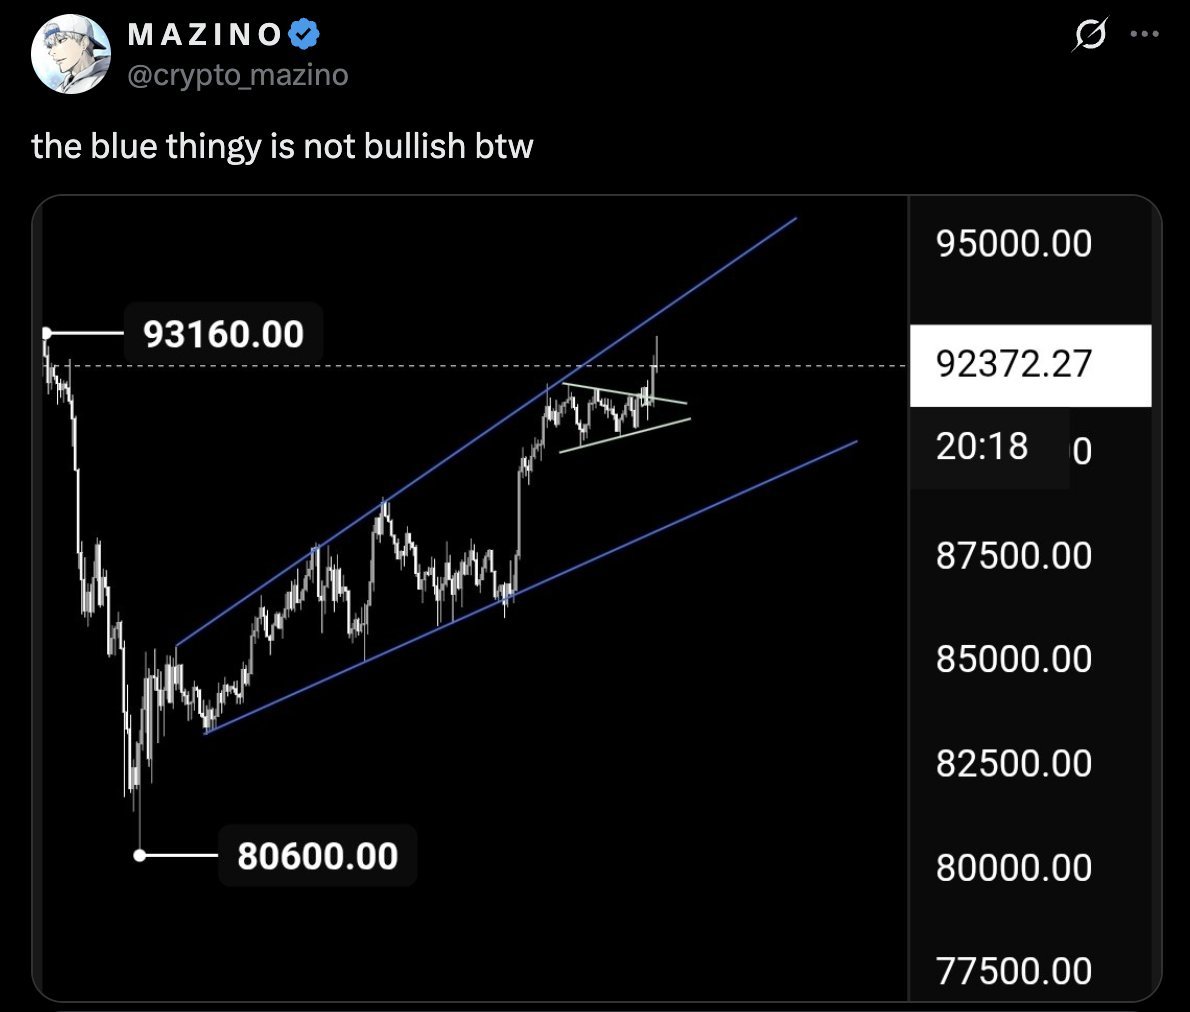
Looking at price action, we had a clear channel forming - generally deemed a continuation pattern. Also, the recovery of a higher price had more of a corrective look. When I say corrective, I mean compared to the downtrend. So the continuation is downward.
So, as I stated many times recently, I was looking for a short position and placed some limit orders for that.
As you might know, those didn't get filled. Why Anon? Well, because I'm a donkey, and overlooked a major indicator. So we have a look at it today because we try to avoid doing amateur hour again.
2. Cumulative Volume Delta aka CVD
So what the hell is CVD?
Market buys - market sells = delta, or Δ
Now, the cumulative part reference the running total.
So if we had (starting) period 1 yesterday with a 100 positive delta, we'd have a CVD of 100. Give a 20 negative delta today, and today we'd have a CVD of 80. Another negative delta of 20 tomorrow, and we'd get a CVD of 60. and so on. I'm oversimplifying, but you get it.
So, it tells us how aggressive the market is in a certain direction.
Let's fire up @kiyotaka_ai and add CVD to the chart we prepared from the last article. Sign up if you haven't, use my reflink if you're an overachiever: kiyotaka.ai/ref=MAZINO
It's free.
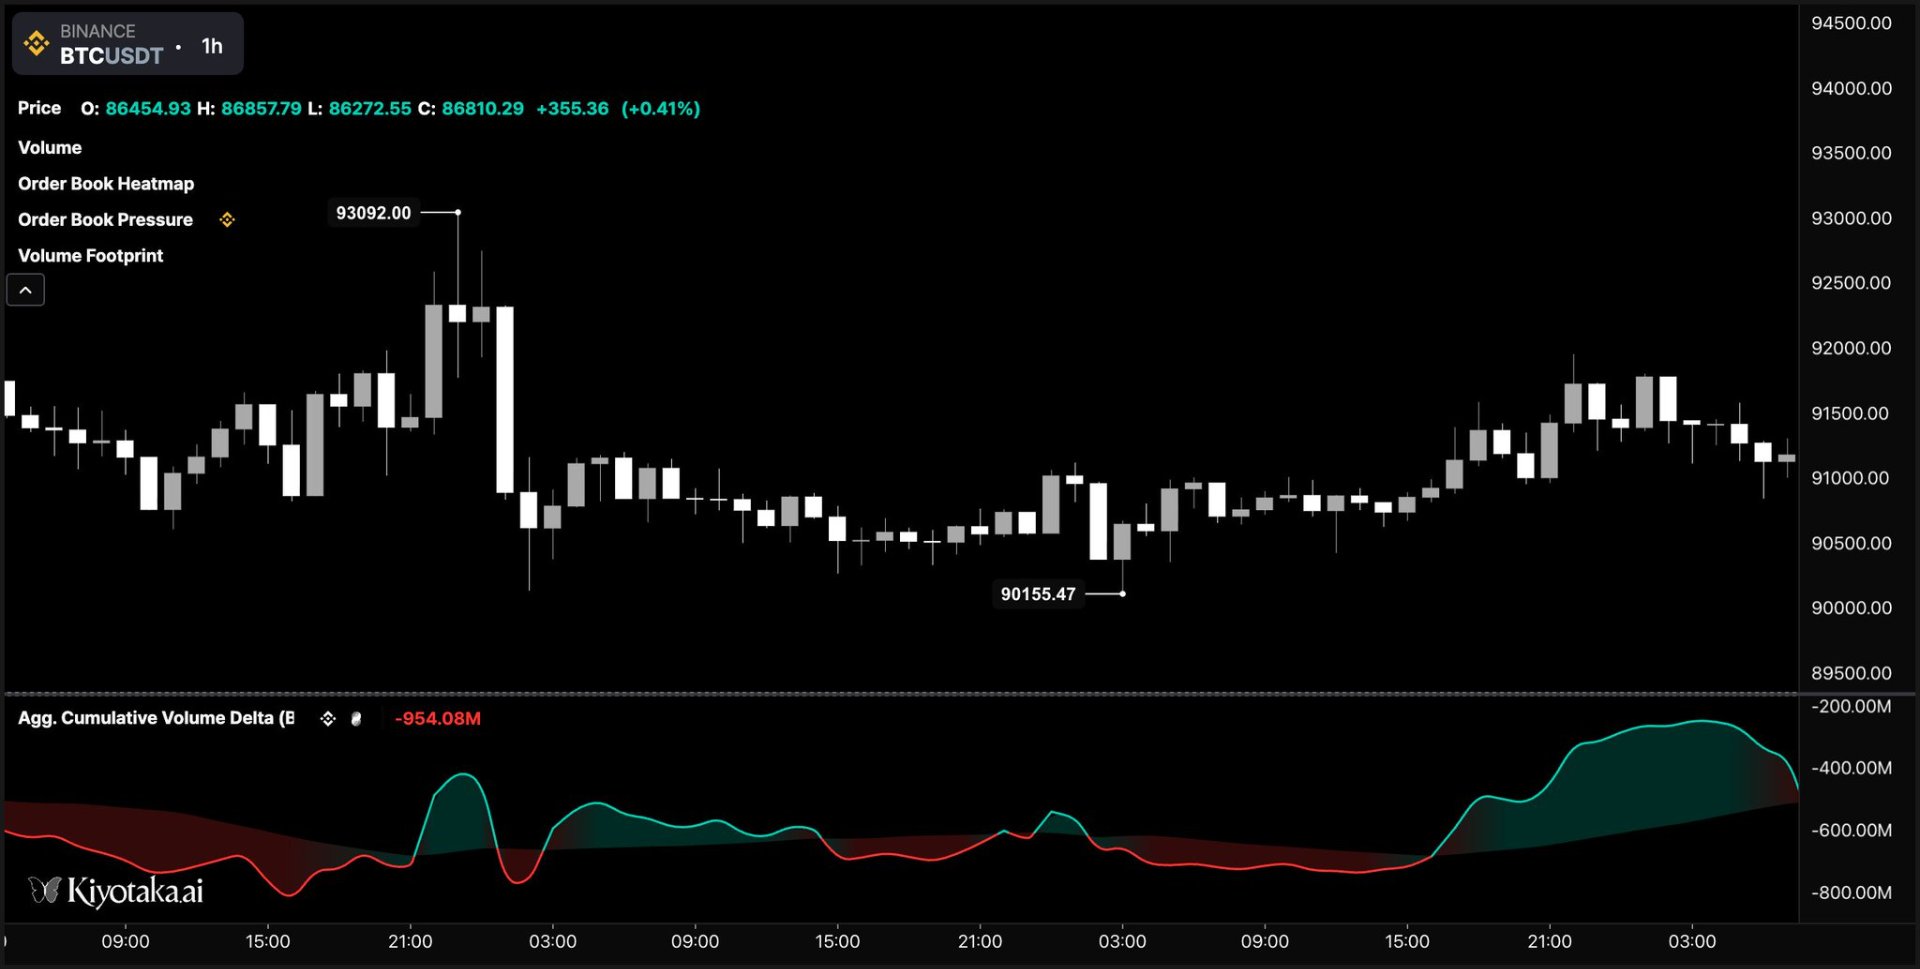
This was the situation on Monday, Dec 1st 2025, early morning, Asia time.
My short limit orders were set at around 92k from the previous night 1 am Asia time, as I inferred we would get an attempt at taking out the previous local high before nuking miserably towards the monthly low.
So how did I end up being late for the party?
You probably see where this is going. Let's check the CVD again and bring our crayons with us this time.

Crayons good, Anon
So if we woke up in the morning and checked things like disciplined traders do, we would've taken the local high at 93k (spot, Binance), the second attempt to retest that level, and drew a line.
Then we would have found the corresponding points on the CVD plot, and drew a line there too.
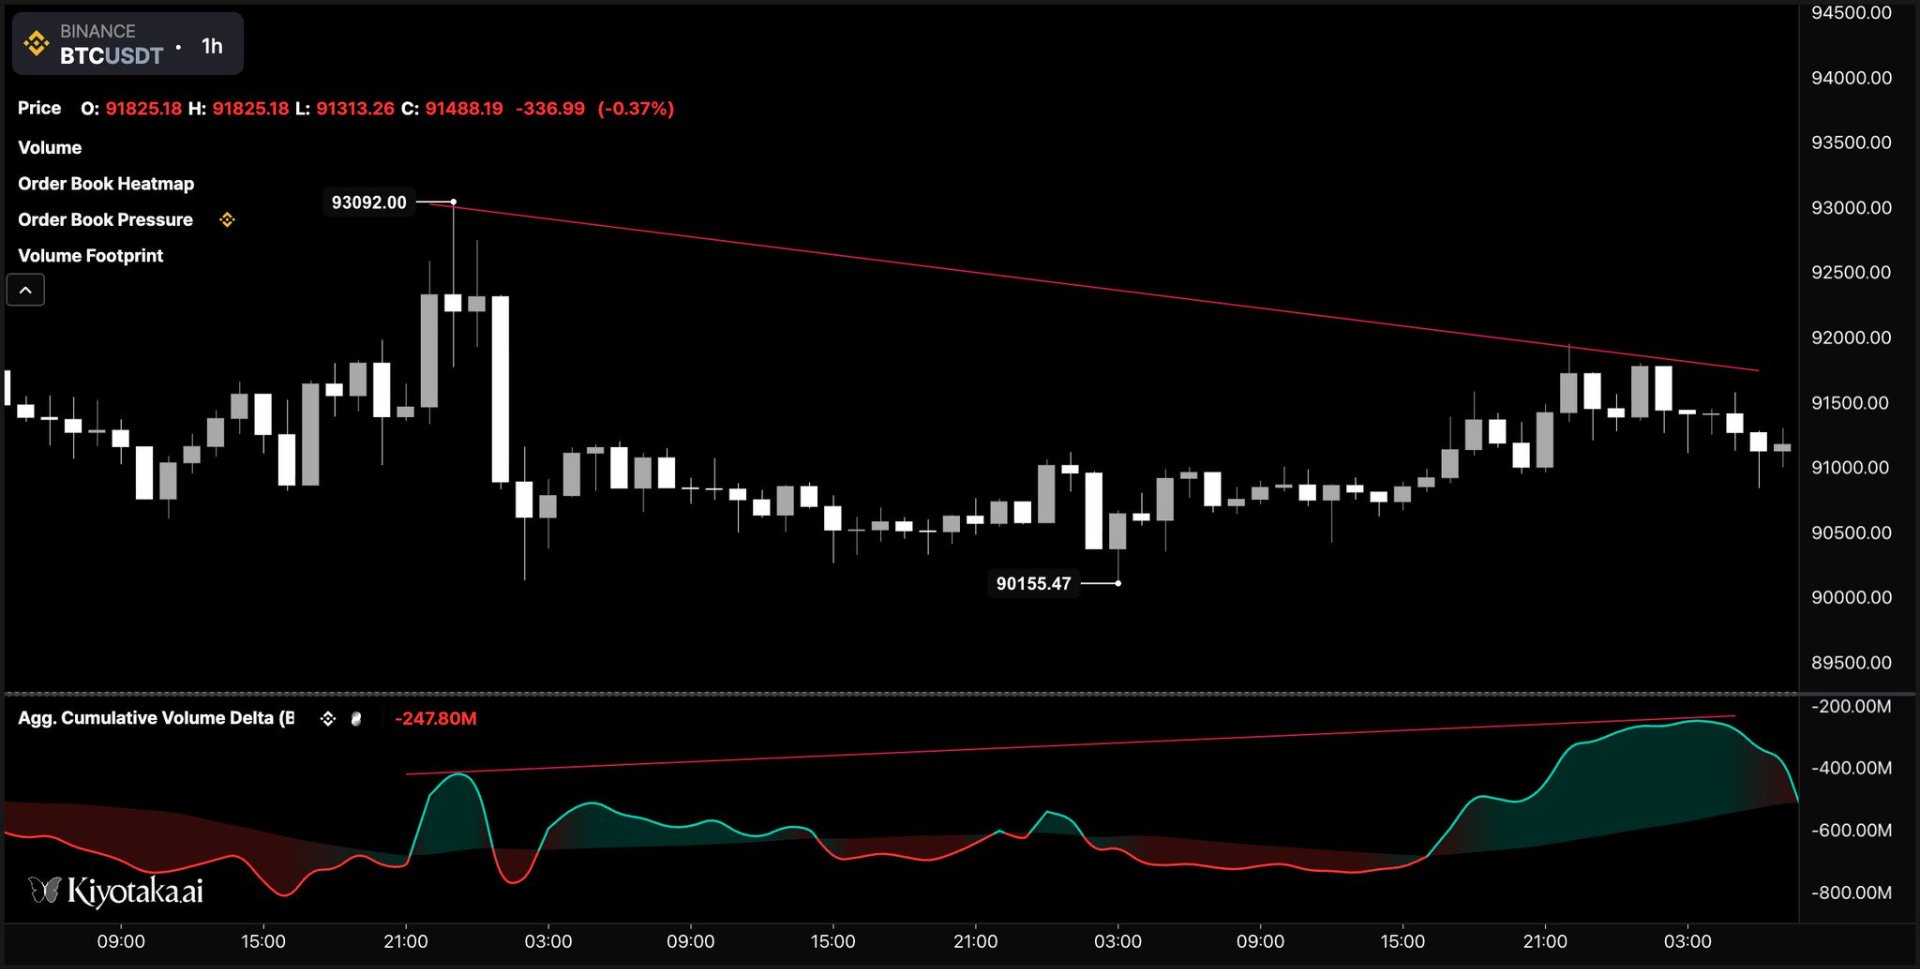
That's a big ass divergence there.
Oh shit, Anon, it's a divergence! But what does it mean?
Well, we already know that CVD tells us how aggressive market orders were. The CVD says market orders were very aggressive, yet the price chart says that price didn't move much despite this aggression.
Like, price action is telling you something, but it's lying. You want information to be consistent. If the information is inconsistent, maybe there's an inefficiency you can exploit. Or something like that.
E.g. buyers did a lot of effort, but achieved little. Like, they tell everyone they really worked hard. Then you look at what they did and it amounts to disappointing results. Looks bad.
So the responsible, disciplined trader would've checked this and understood that we would probably not make it to 92-93k.
What else?
That limit sell orders absorbed a lot of bulas and sellers had more to give: it was t-minus 1 to Goblin Town.
Ended up entering this trade at the market at 88k and only rode the few last candles to about 86k.
Which leads us to the second part of today's article.
3. Footprint and momentum.
How can we know if we're just late to the party, but the party is still going for some time and we can actually have some fun?
Well, all parties have people talking. People talking make noise. If you hear people talking from outside the venue, the party is reasonably interesting. So interest for a party can be tracked by loudness? idk. But Market shows interest with volume, among other things.
The following footprint show us how interested the market was to trade certain levels.
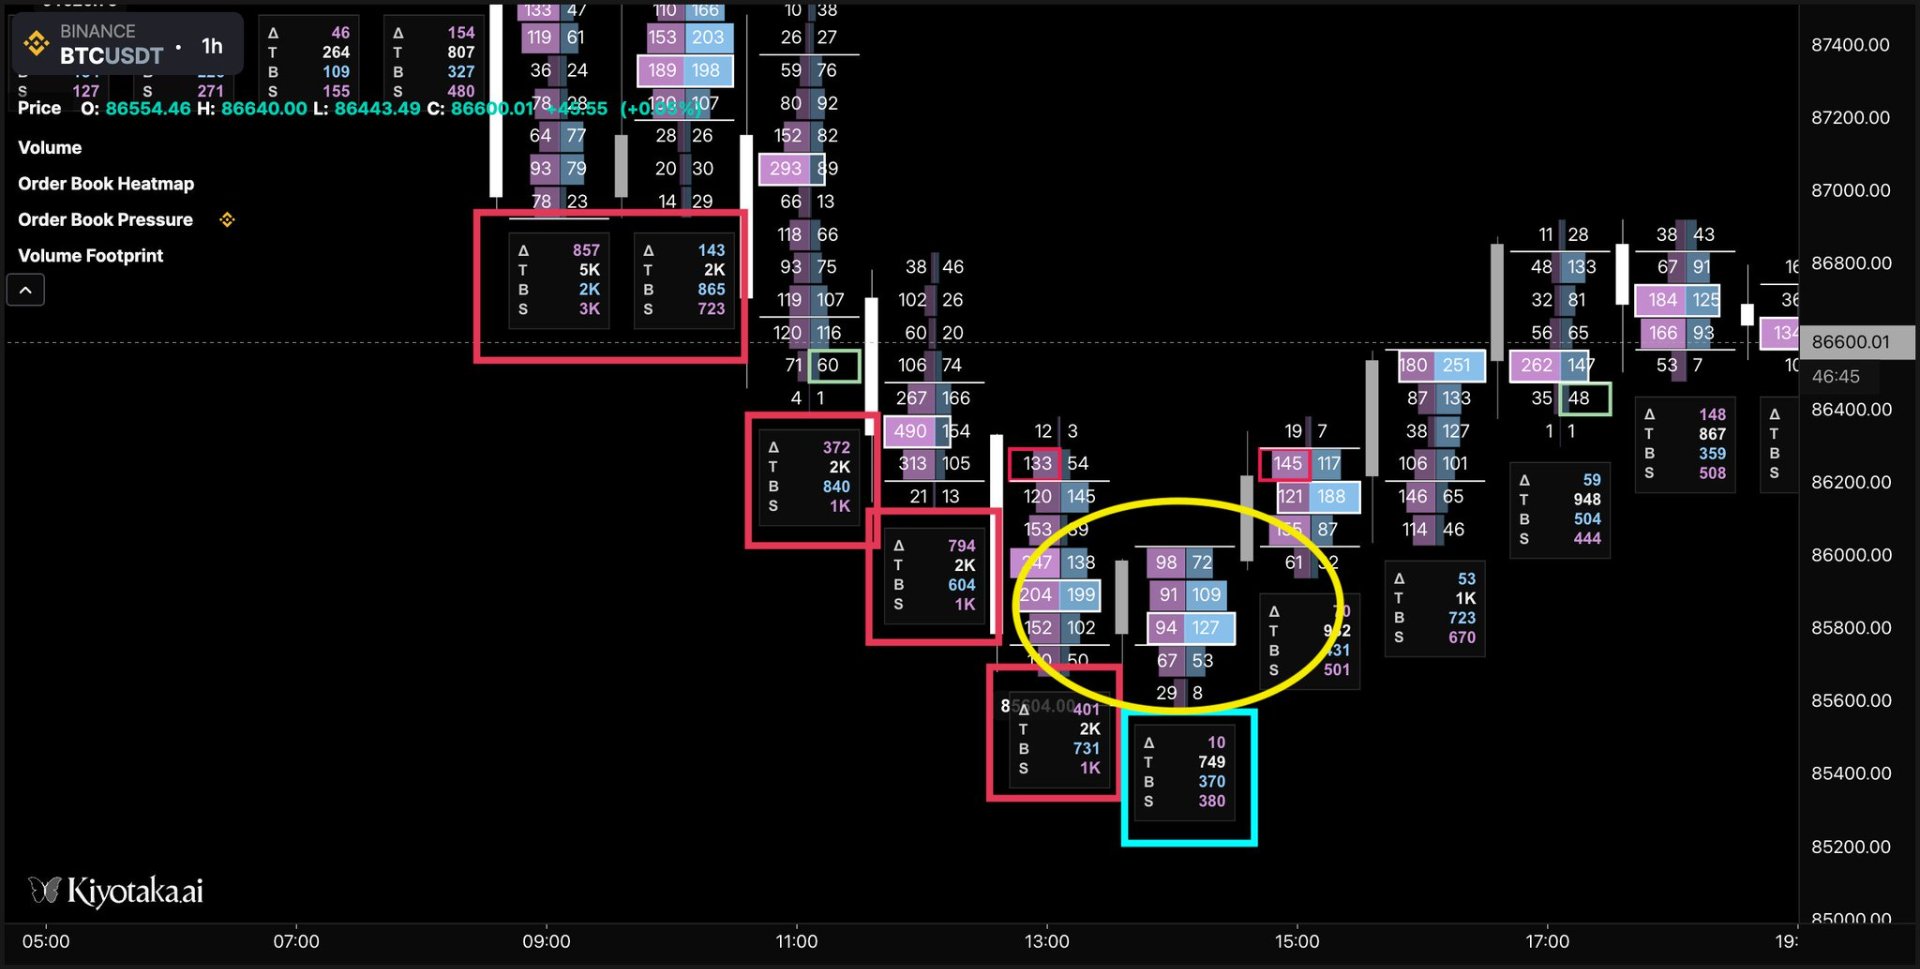
Check total volume (T), and deltas.
So total volume (T) has a spike on the first big ass candle, and then stays pretty consistent. Although there is a positive delta in the second footprint, price is rejected quickly to the lows. The next 3 footprints are consistently high volume (2k), with a consistent negative delta and sales. Not that delta is extremely relevant here, since many are trying to catch the falling knife.
Things shift on the footprint marked with aqua color. Interest (volume) is significantly lower, no one is interested in this party anymore. The range is narrow and the lower part of the footprint has very little trades.
Well, now this party sucks.
We can now close our short position.
4. Conclusion
Why is this stuff useful? Orderflow gives you insight into what happens "inside" a candle. Many in this space try to catch perfect entries/exits, and if they stick around long enough, they learn that there is no such thing.
However, there are good and bad entries/exits from a position. I think Orderflow shines at this when used in conjunction with profile.
CVD can help you find an edge for entries and exits alike.
At the same time, softening entries and exits can help you maximise returns on a good plan. Execution is a bitch, right Anon?
I've been yapping a lot about why I was expecting this dump to the 80k range, had an inference about the "when", but not about the "how".
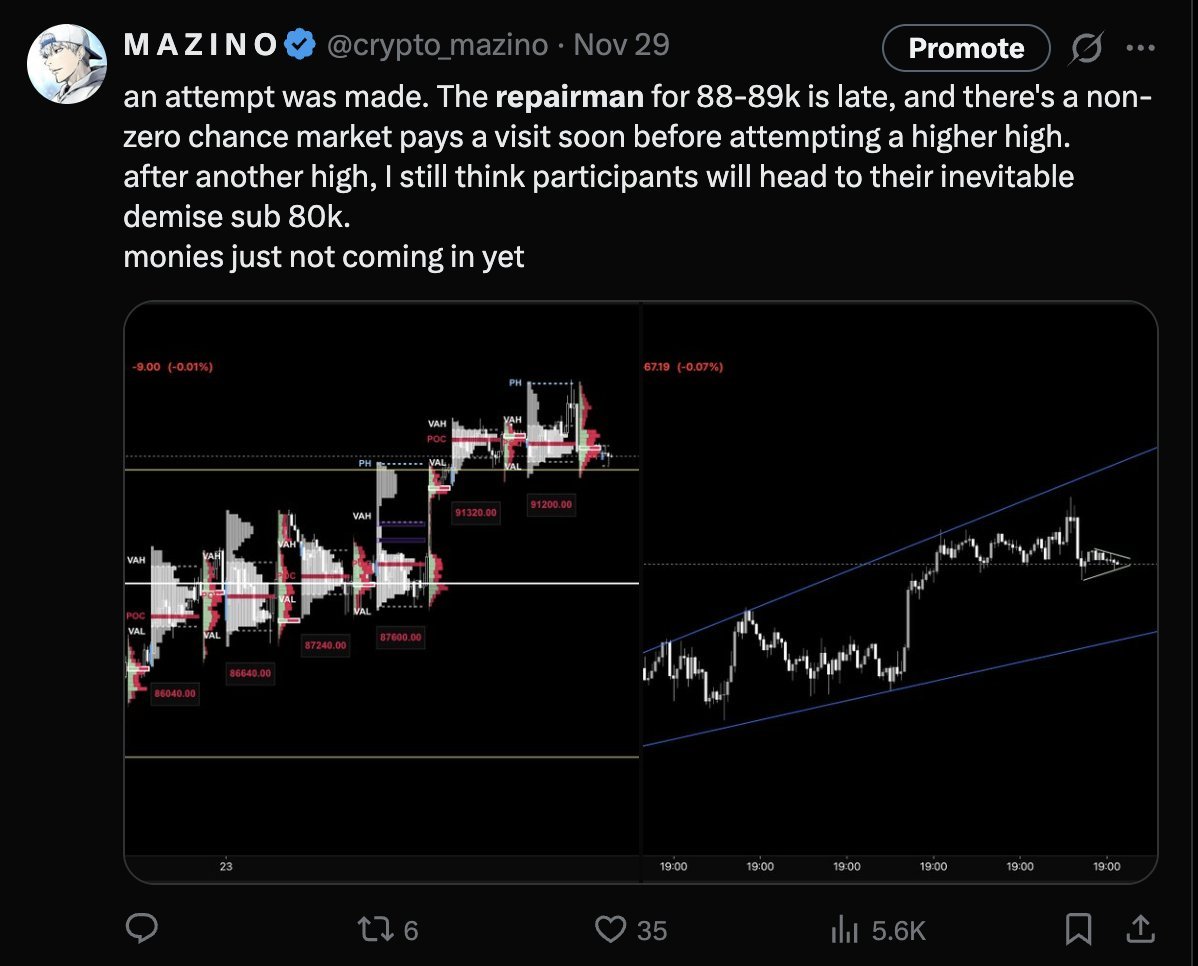
So reading the footprint helped get a good exit despite the bad entry. Was it a generational short I planned? Not at all. But there was a little profit, and that matters too.
Now let's see if we keep rolling with this downtrend, or if the market can find some strength.
Until next time.