Price Action Series #1
Many of the folks who reached out to me for clarification lack a Price Action foundation. Time to fix this. Let's go.
0. Foreword
I will dumb everything down. If you feel like I treat you like a retard - well, I do, but I'm a retard myself. Also you really master something when you can explain it to a 5 years old. I think it was Feynmann who started this? well, I'm not Feynmann.
If you're an experienced trader, you will find a lot of approximation in this series. It is voluntary. This series is meant to give a basic knowledge so Anons can finally understand what the hell is going on and hopefully see a positive balance in the medium term. There's time for perfection later.
Alright Anon, take your crayons and let's draw some lines.
1. Support and Resistance levels
You might have heard about these. Support and resistance (S/R) levels are price levels where the market is likely to see increased trade volume. Therefore, we can expect some sort of reaction there.
Supports and resistances can be interchangeable: a support might turn into a resistance, and vice versa. We call this an "S/R flip".
Why are S/R important? Well, because people are interested in those prices. Price is an advertising mechanism for a certain good (in our case, an asset). S/R levels are excellent advertisements, and market participants rush in to buy and sell there.
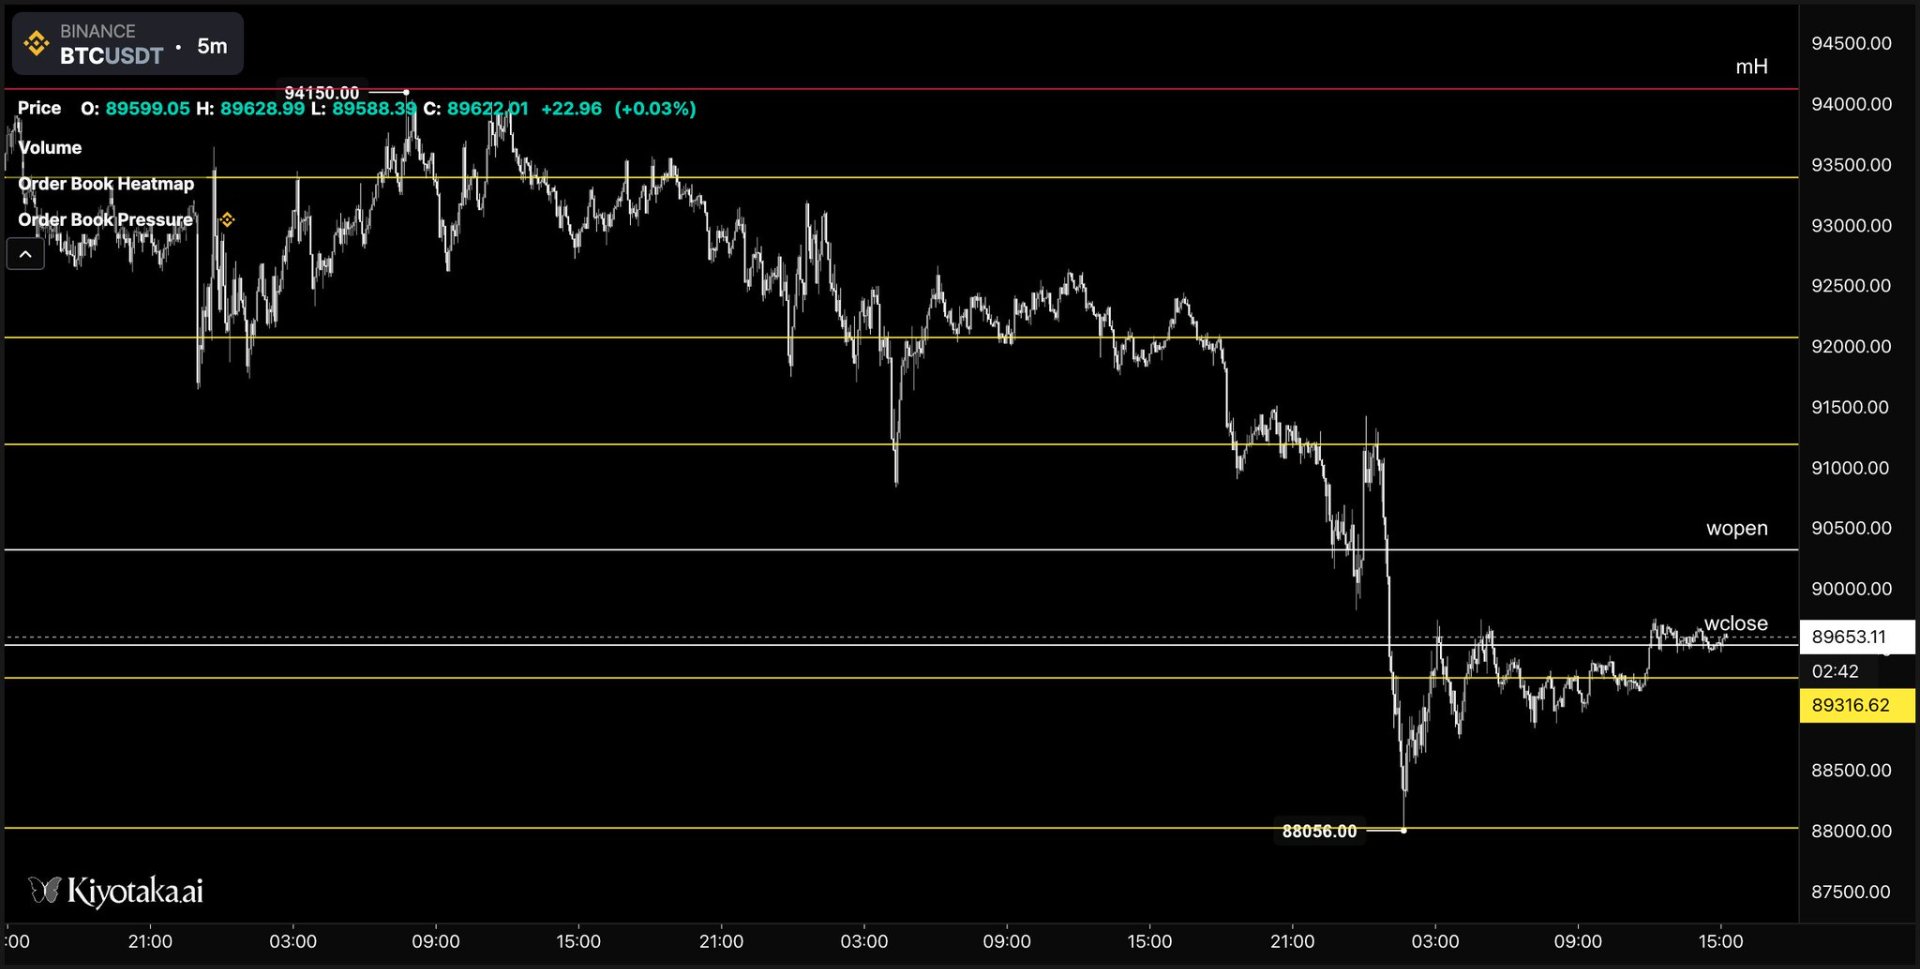
A cool thing about S/R is that the reaction generally implies that we will see a relevant move in a given direction after those levels are touched. Why is that?
Well, to put it simply, when you buy or sell something, you want the price of the good you're trading to move in your favor. If you bought, you want prices to increase to sell at a profit. If you sold, you want to see the price decrease to purchase a larger amount of your preferred asset.

How is this achieved in a market with many participants? If sellers dominate, they won't buy an asset back until the price is much lower than their last sale. Vice versa, if buyers dominate, they want to see much higher prices before they are interested in selling.
Whoever is in control will refuse to transact until they can exert their (perceived) maximum profit.
Ideally, this will be the next S/R level in their preferred direction.
Why? Because there is a significant chance that the price will reverse on them.
So, how do we find S/R, Anon? Let's open Kiyotaka and set a $btc candlesticks chart, 1 Week timeframe.
Your chart should resemble this.
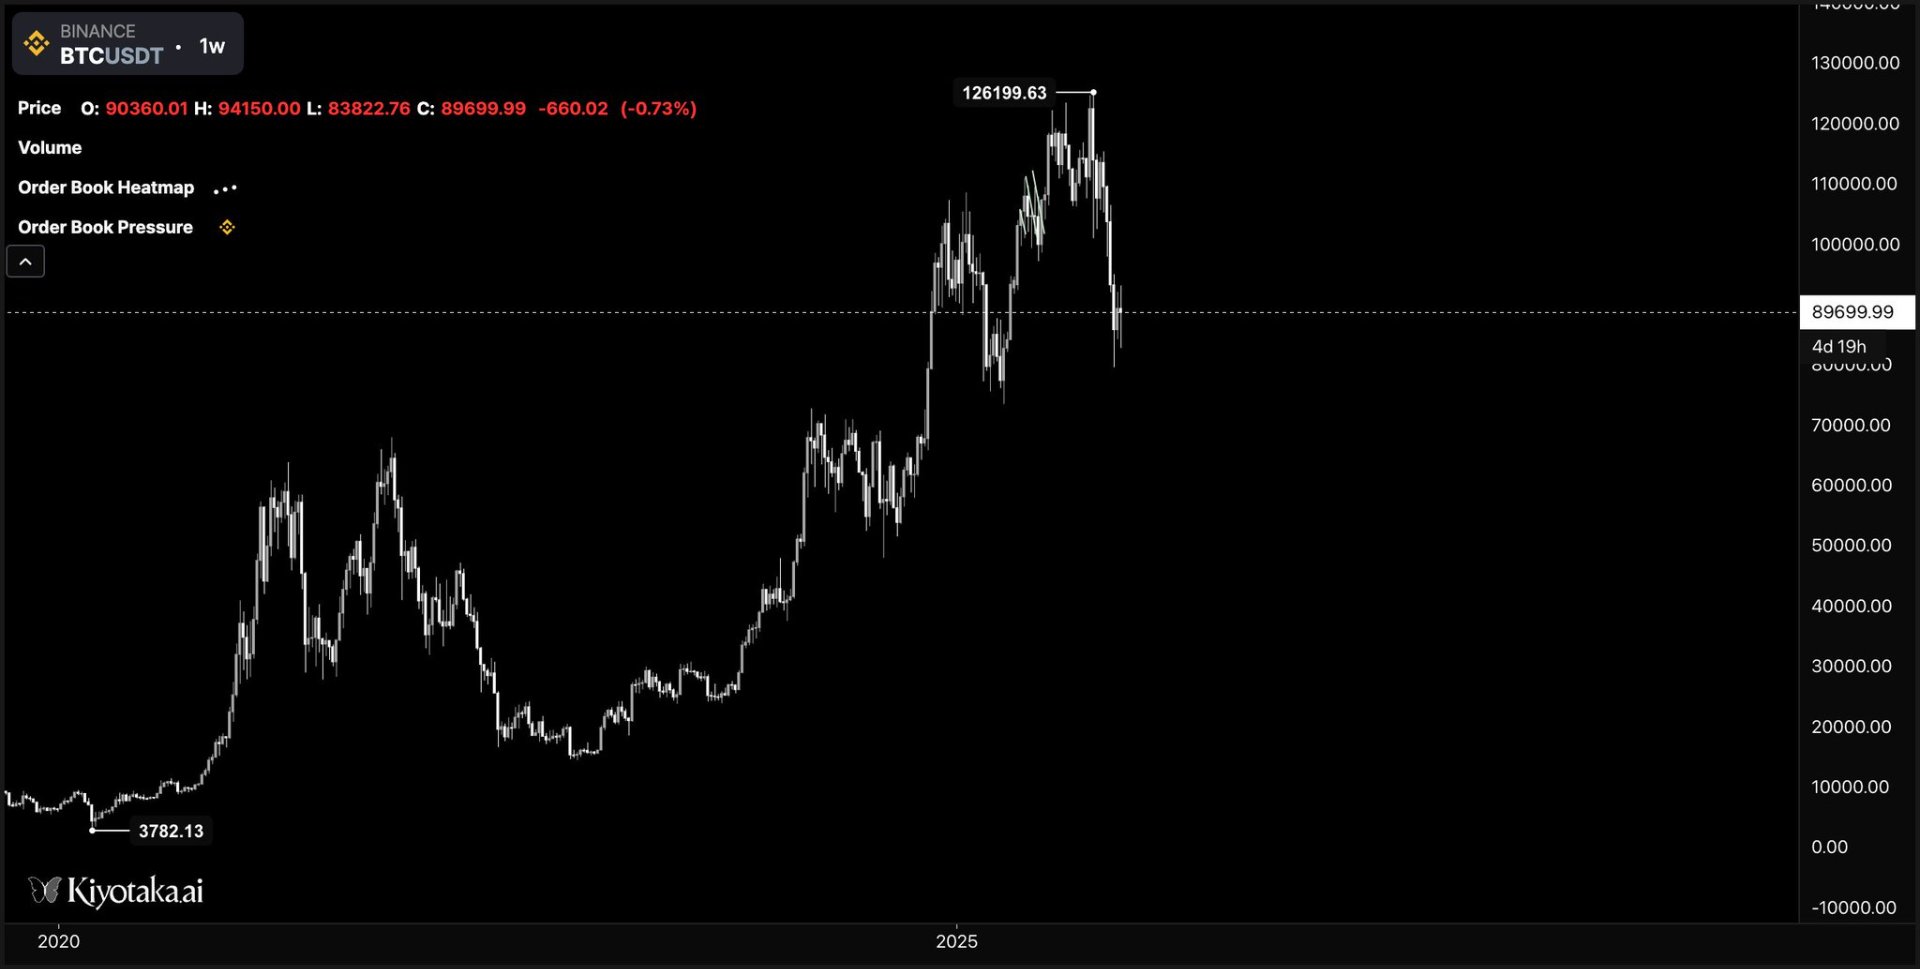
I don't use green and red. Feel free to use the colors you like the most.
On the vertical bar to the left-hand side, select the drawing tool "Horizontal line".
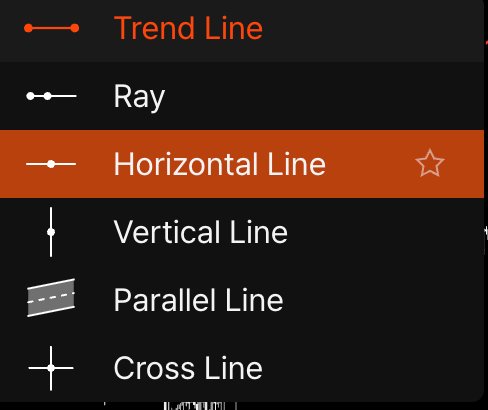
Now we can draw a straight line! But where do we draw it?
We need to pick interesting points, and we need to use all of our 12 neurons to do this.
The methodology is the following: we go from the highest time frame, to the lowest (local).
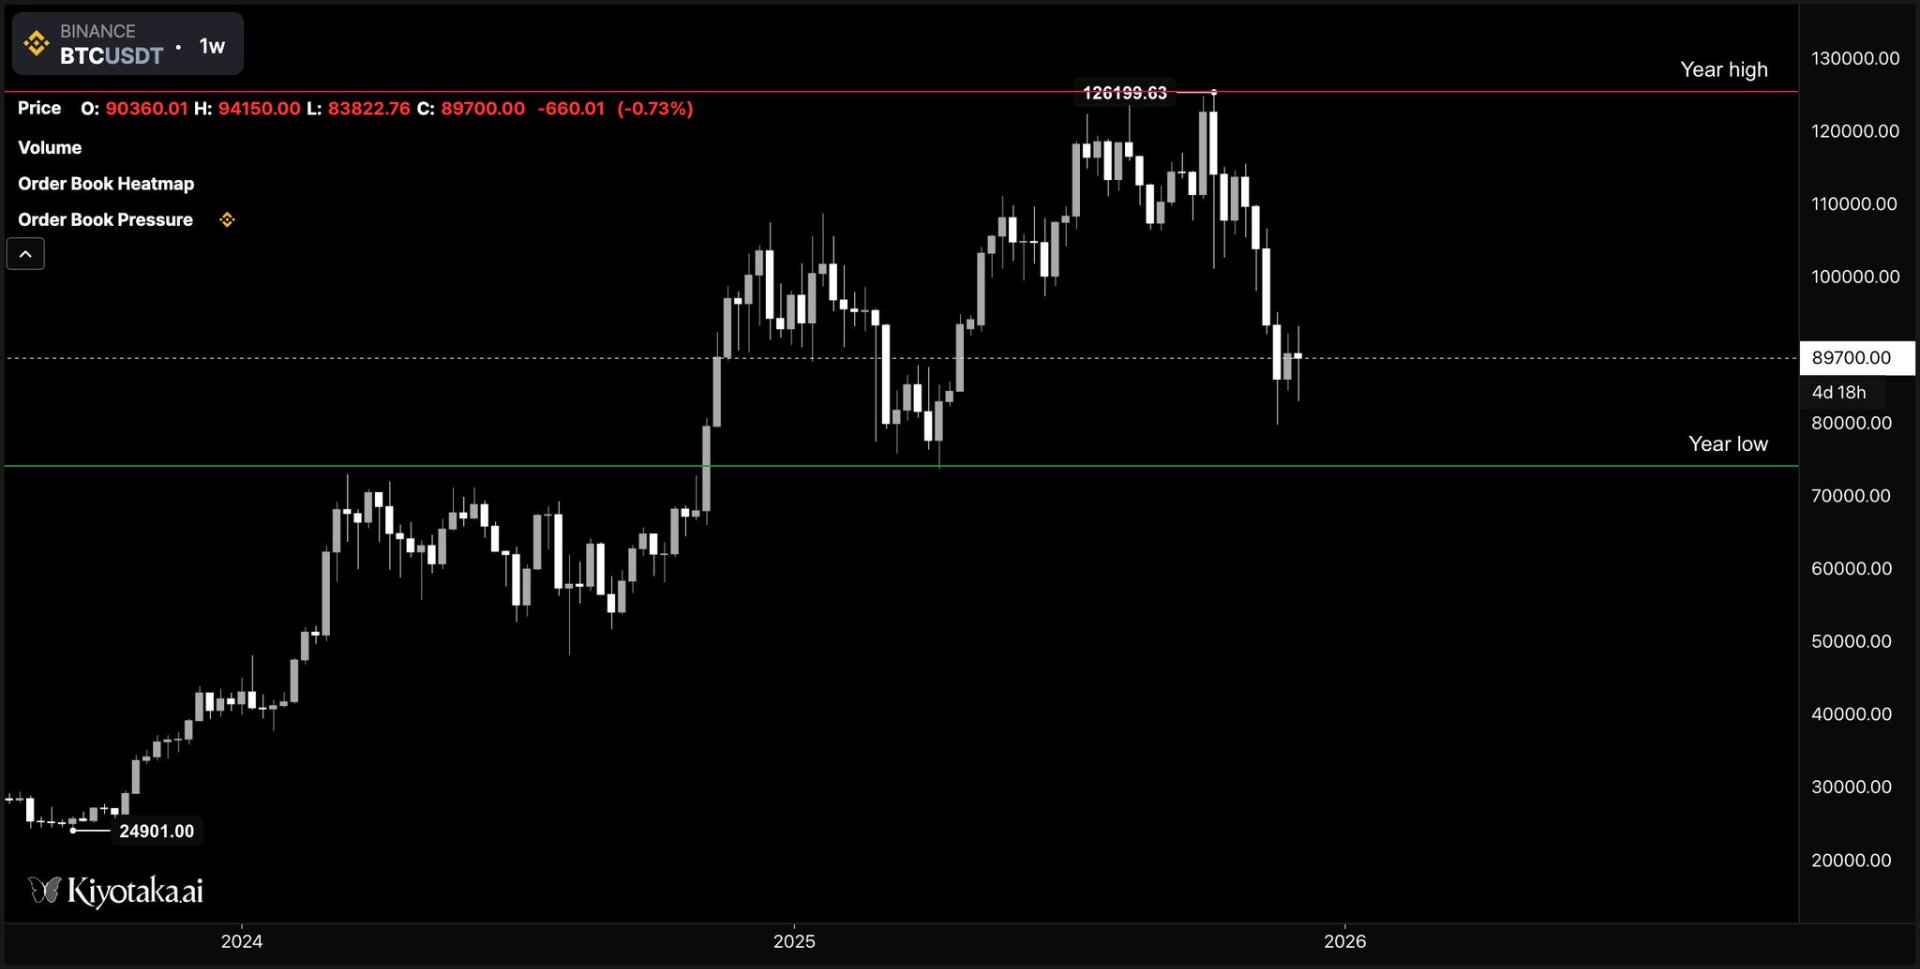
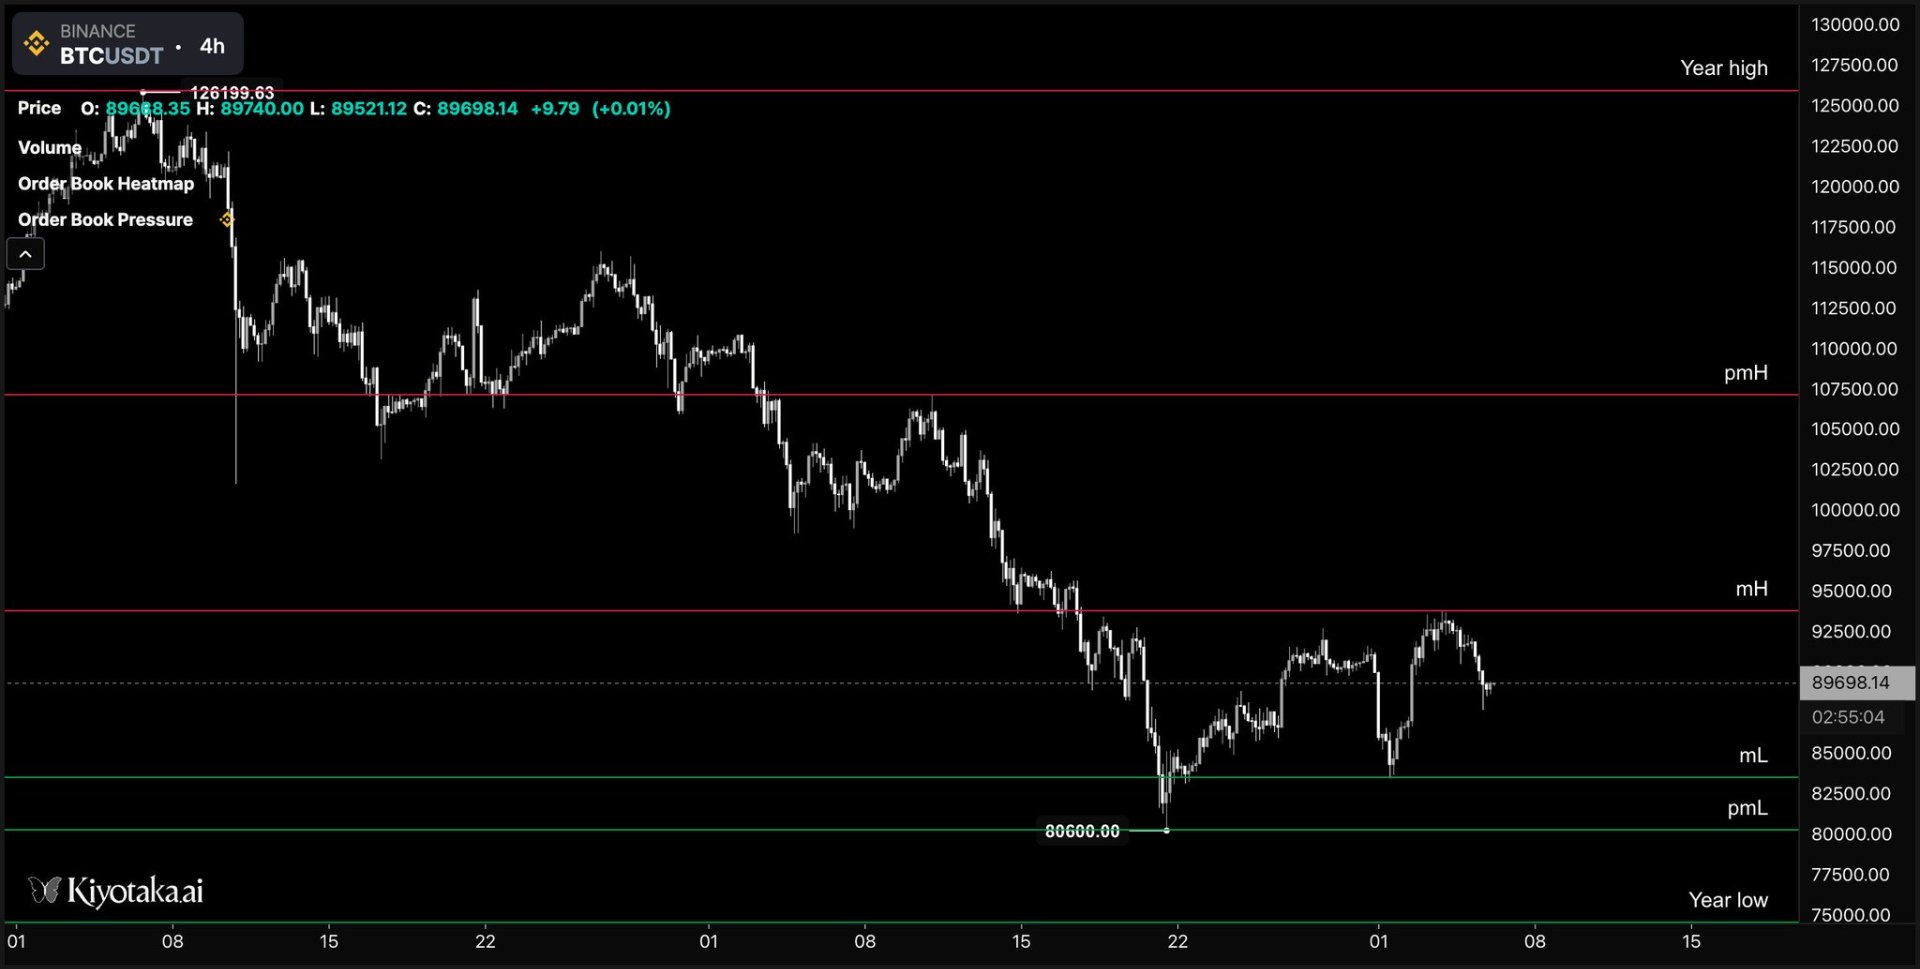
First, we look for Yearly highs and lows (yH/L). I marked the Year high in red and the year low in green. We can also add a label so we remember what that is when we bump into it in another timeframe without having to zoom out.
Now we move to the 4-hour timeframe and search for the monthly high and low (mH/L), as well as the previous month's H/L (pmH/L). We label them, ok Anon?
Very neat.
Now we need to look for local S/R. There are two ways of doing this. You either use the weekly chart and look for weekly open and close (a bit trickier), or go down to the 1-hour chart and inspect the weekly range.
We are not afraid of hard stuff, right Anon? So we head to the weekly chart.
You have 2 scenarios. If the current week's range is outside the previous week's candle, you take the current week.
If the current week is inside the previous week's range, you take both.
You are visual animals, so let me show you.
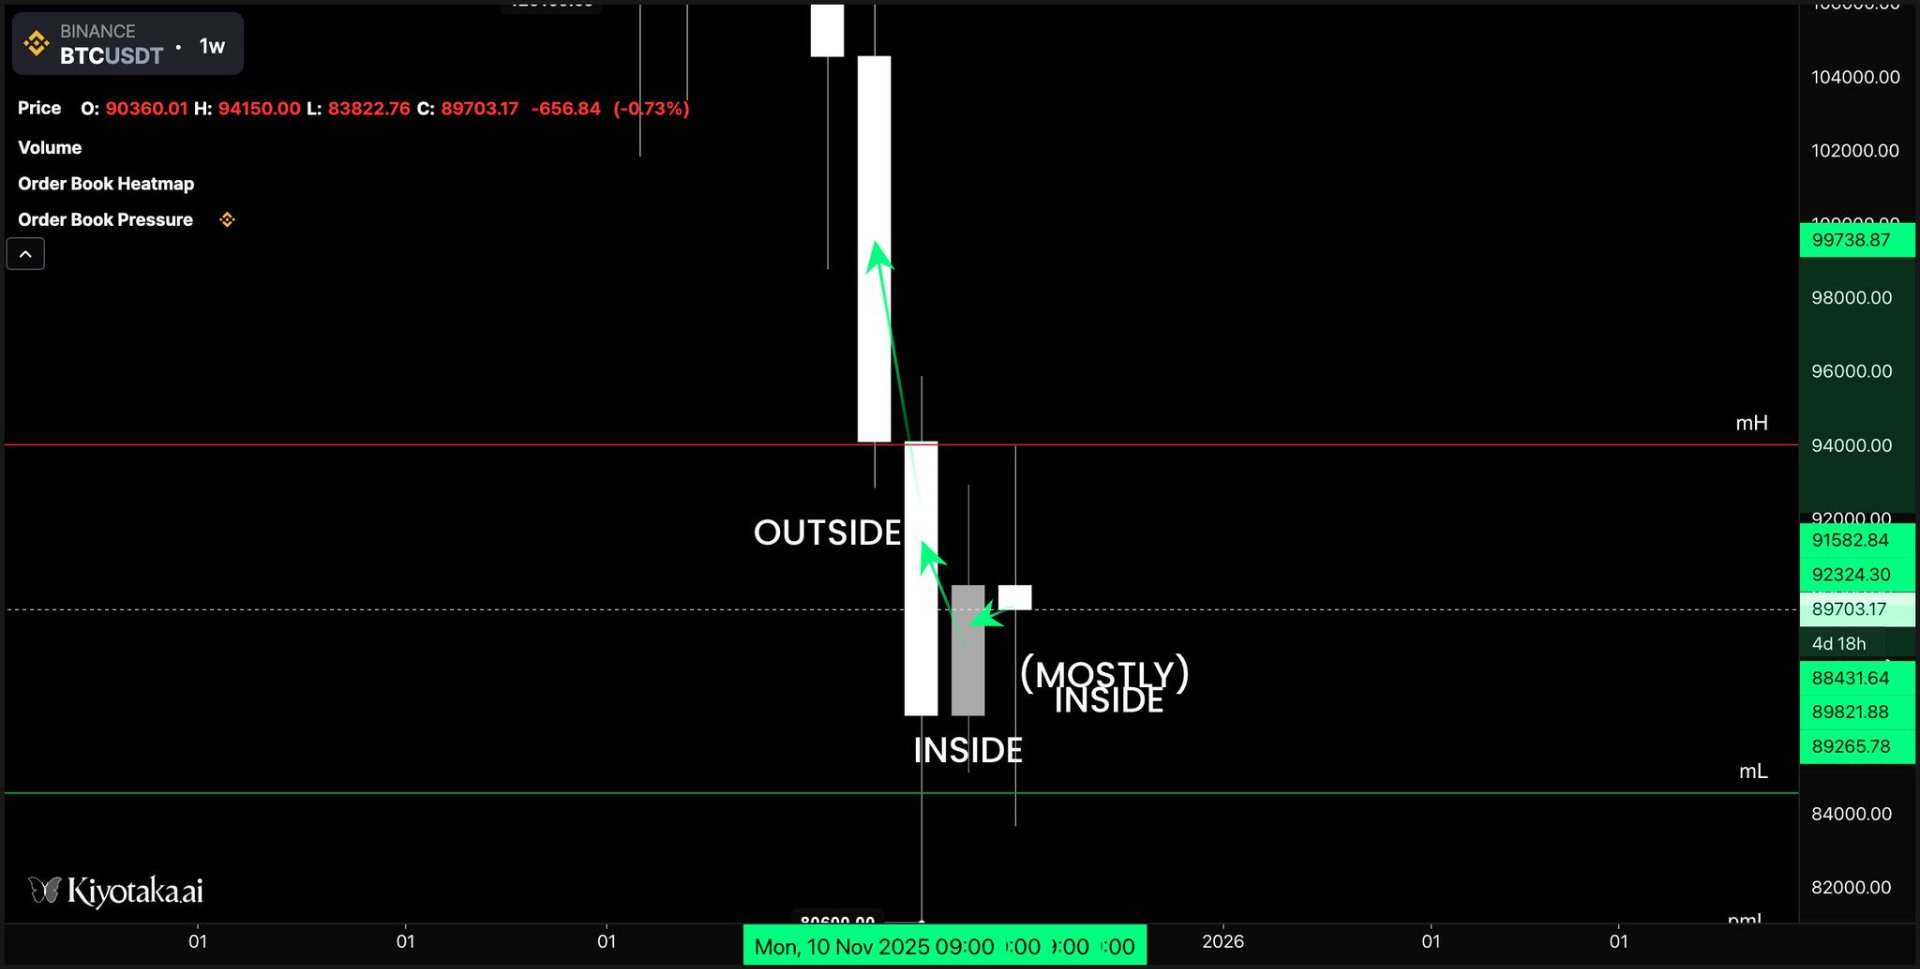
Why do we need this? Because if the current week is inside the previous week's range, it means the last week's S/R are still valid.
Current week's range is inside, so we mark this last week's open and close (wO/C), and previous week's O/C (pwO/C). I'm afraid I have to say this: O/C are the same, mark only once.
Since we are at the end of this week, I will mark the current week. In general, mark the completed week as (wO/C) and the week before as (pwO/C).
I will mark wO/C in white, and pwO/C in yellow.
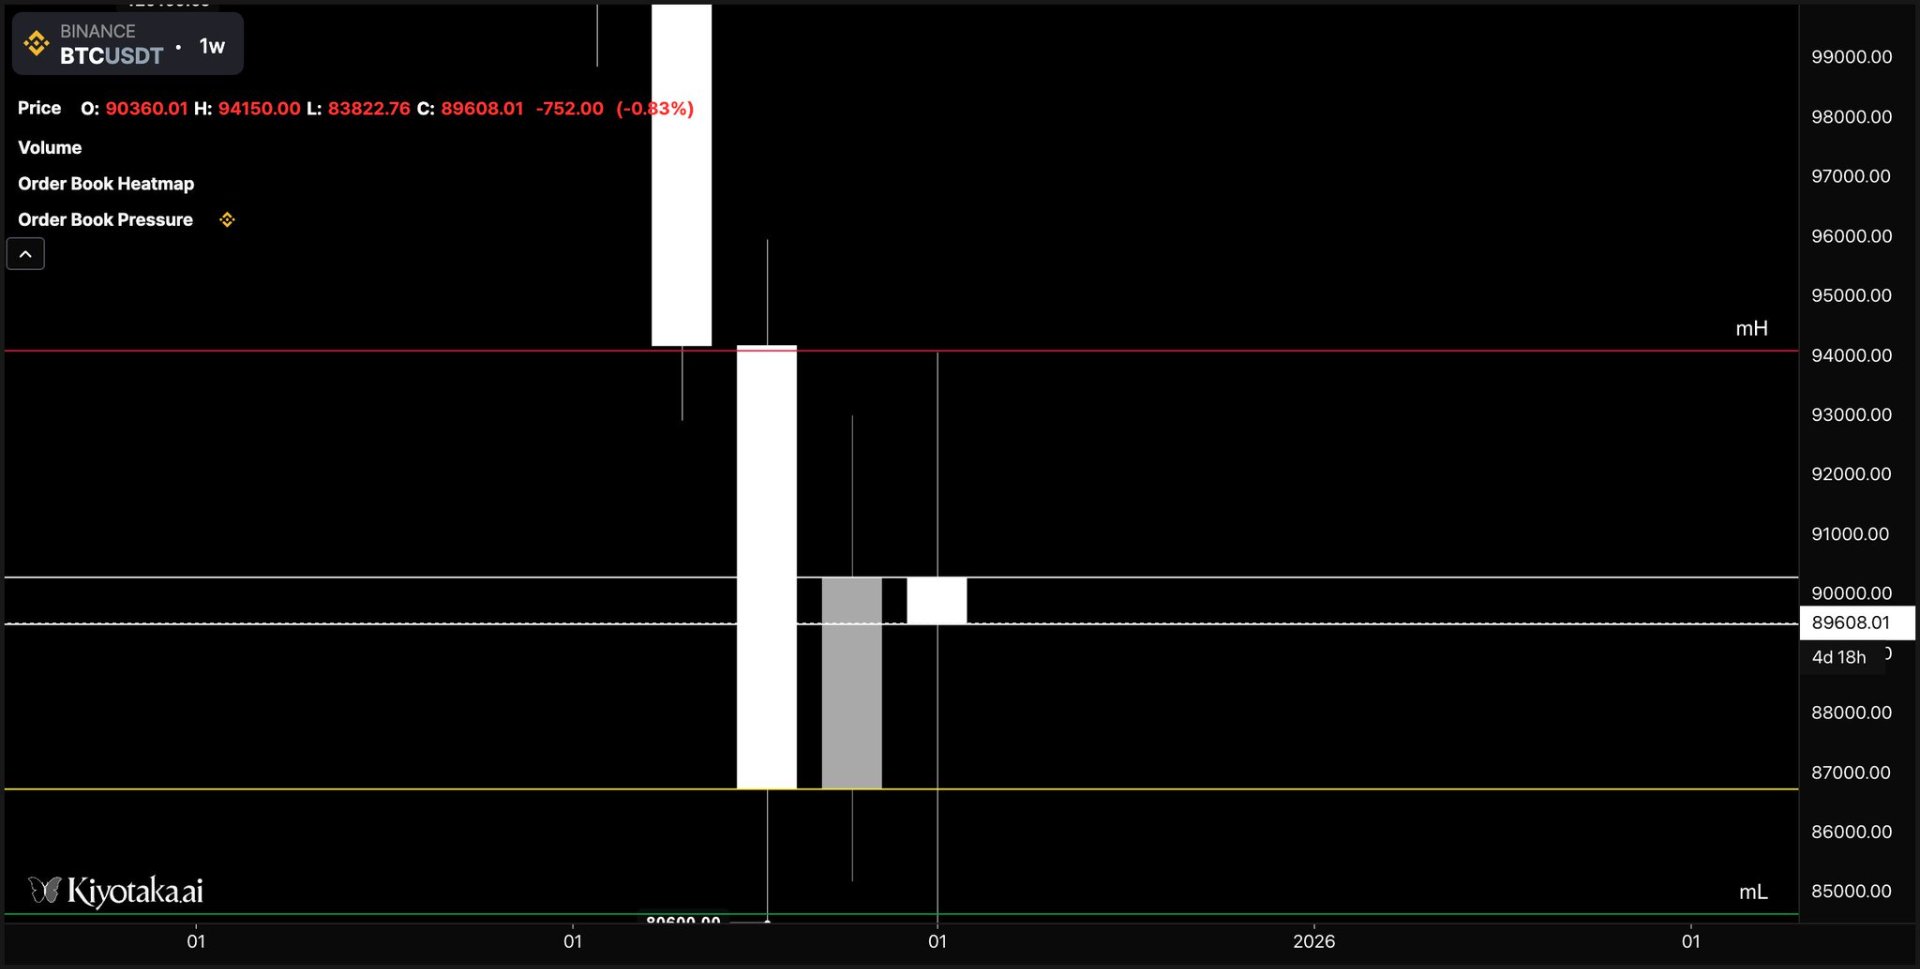
wH is almost the same as pwO, so it was marked only once.
Now let's zoom in to the 1-hour timeframe.
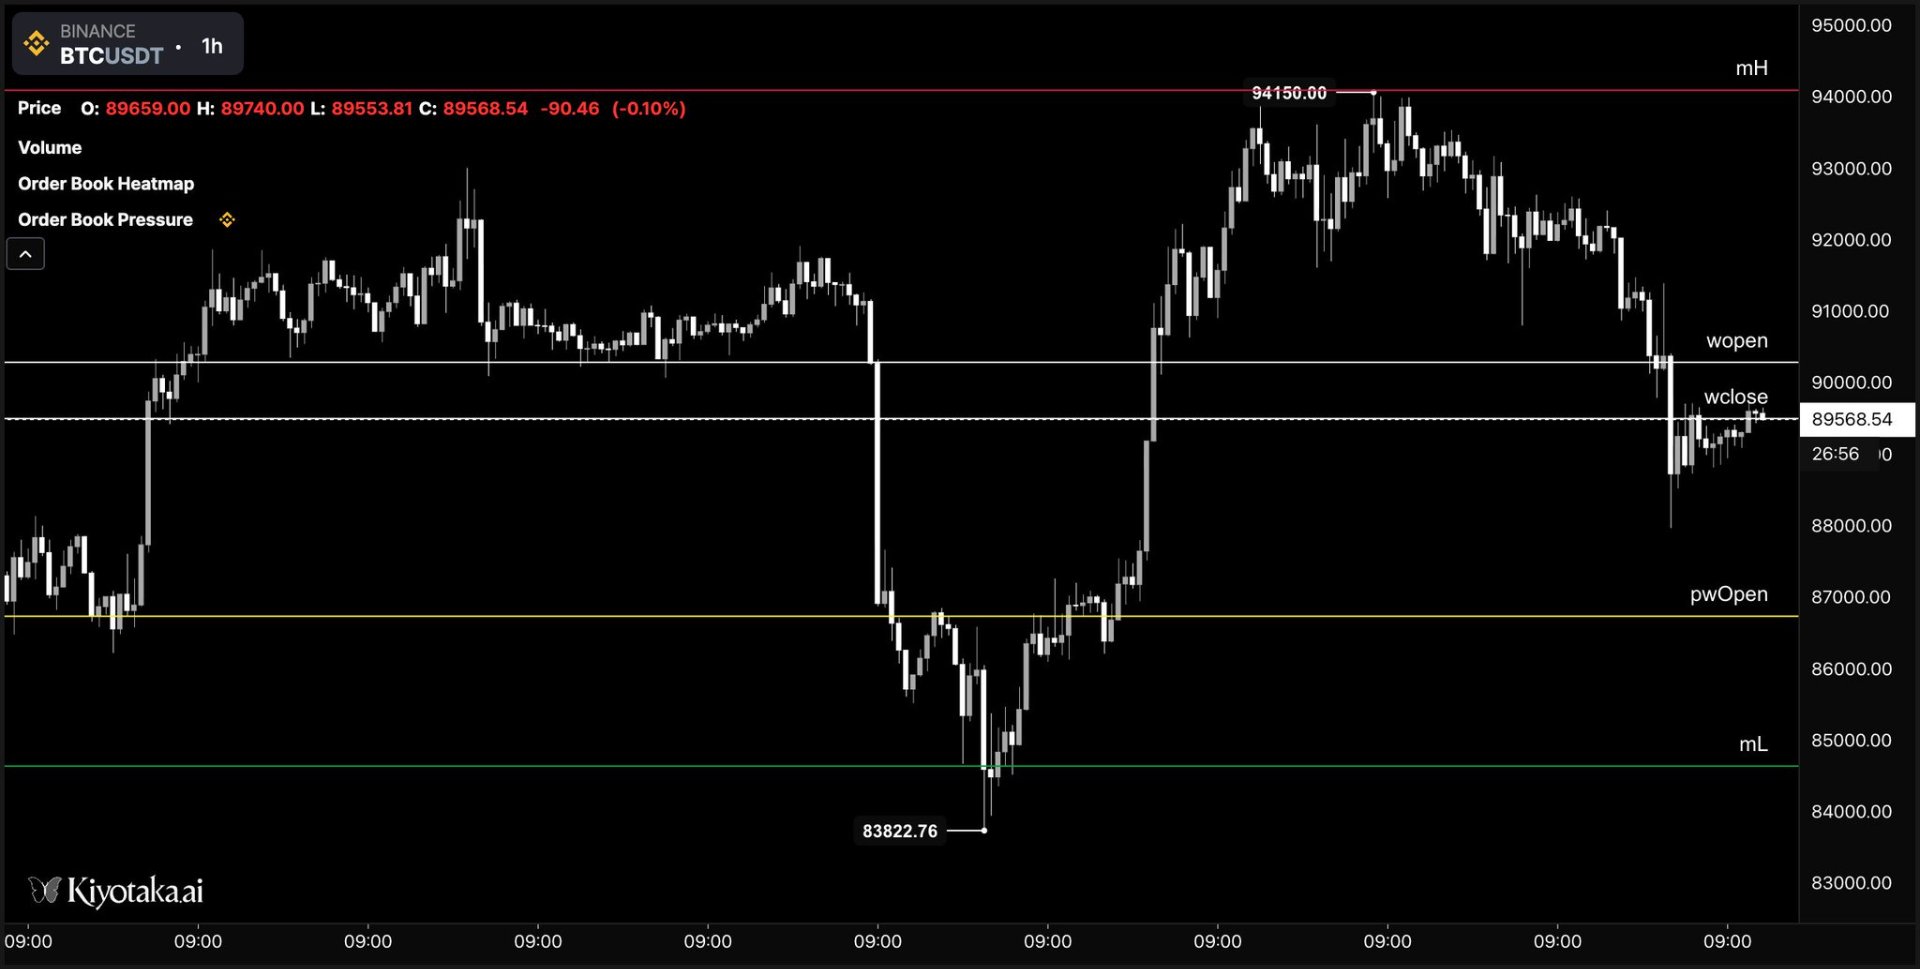
Wow, the lines we drew so far kind of match the most recent price movements. And we didn't really have to do sh*t yet! Amazing.
2. S/R level trading
This is trading 101. You can trade from one S/R to the next one.
Can our monkey brains identify any pattern in the figure above? Yes, we can highlight a few.
- Confirmation requires at least one DECISIVE hourly candle close in a certain direction after a break or a bounce on the S/R. See for yourself.
- Price travels from one S/R to the other.
- Some levels are more relevant than others (see wO/C, less relevant than other levels)
- Once the price action travels from one S/R level to another, there are chances of reversal.
- Price sometimes falls back before moving in a certain direction.
What can we infer from these five patterns?
- We need to wait for a decisive move in a certain direction to confirm a trade.
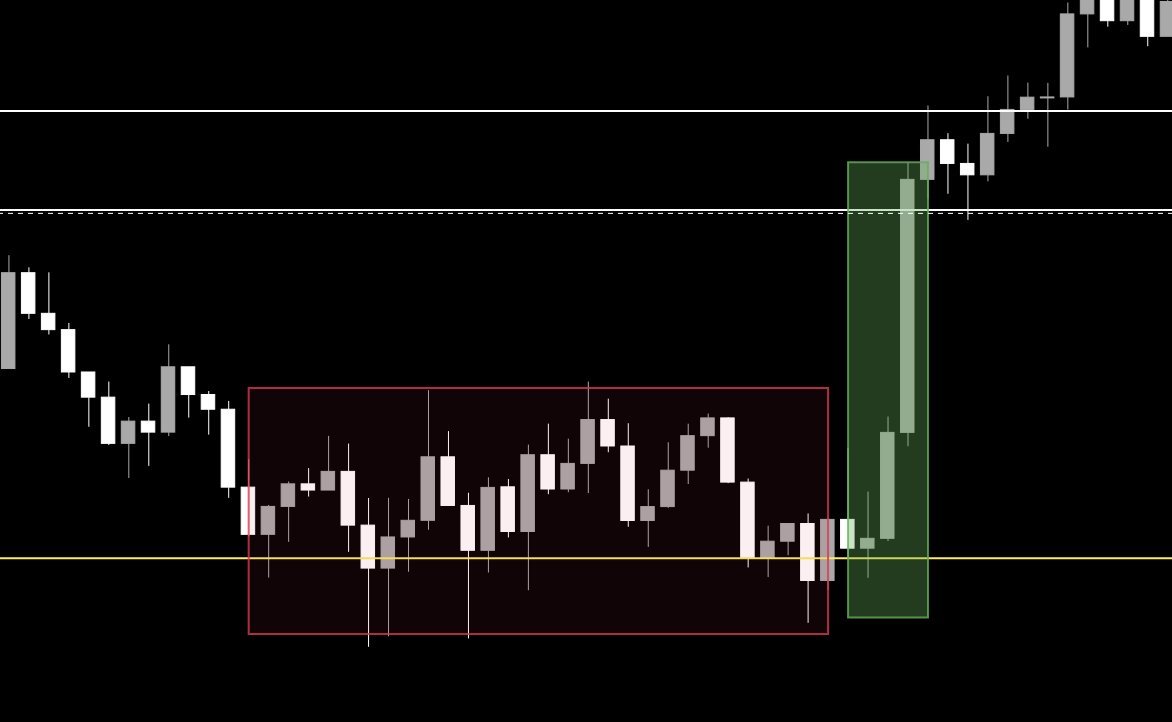
Weird continuation, doesn't defy previous range until next candle.
In a case like the one above, we can wait 1 more hour since we had a similar range, or check the 30-minute chart.
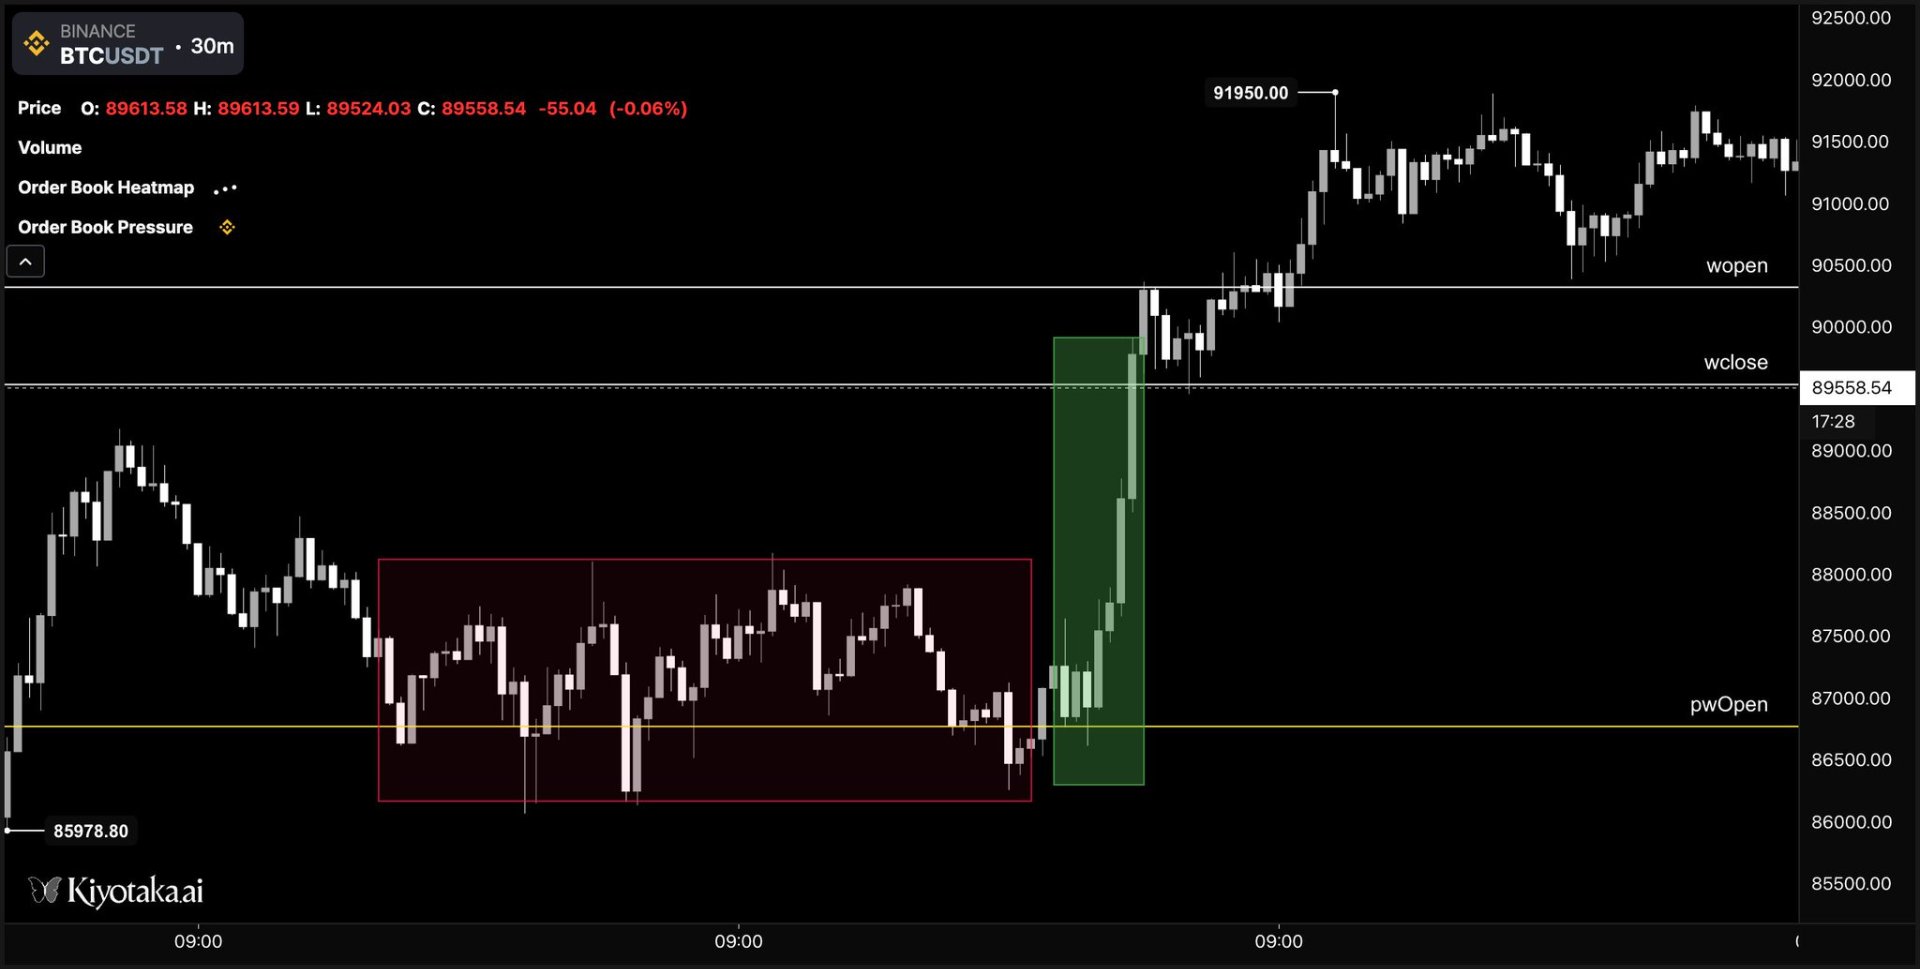
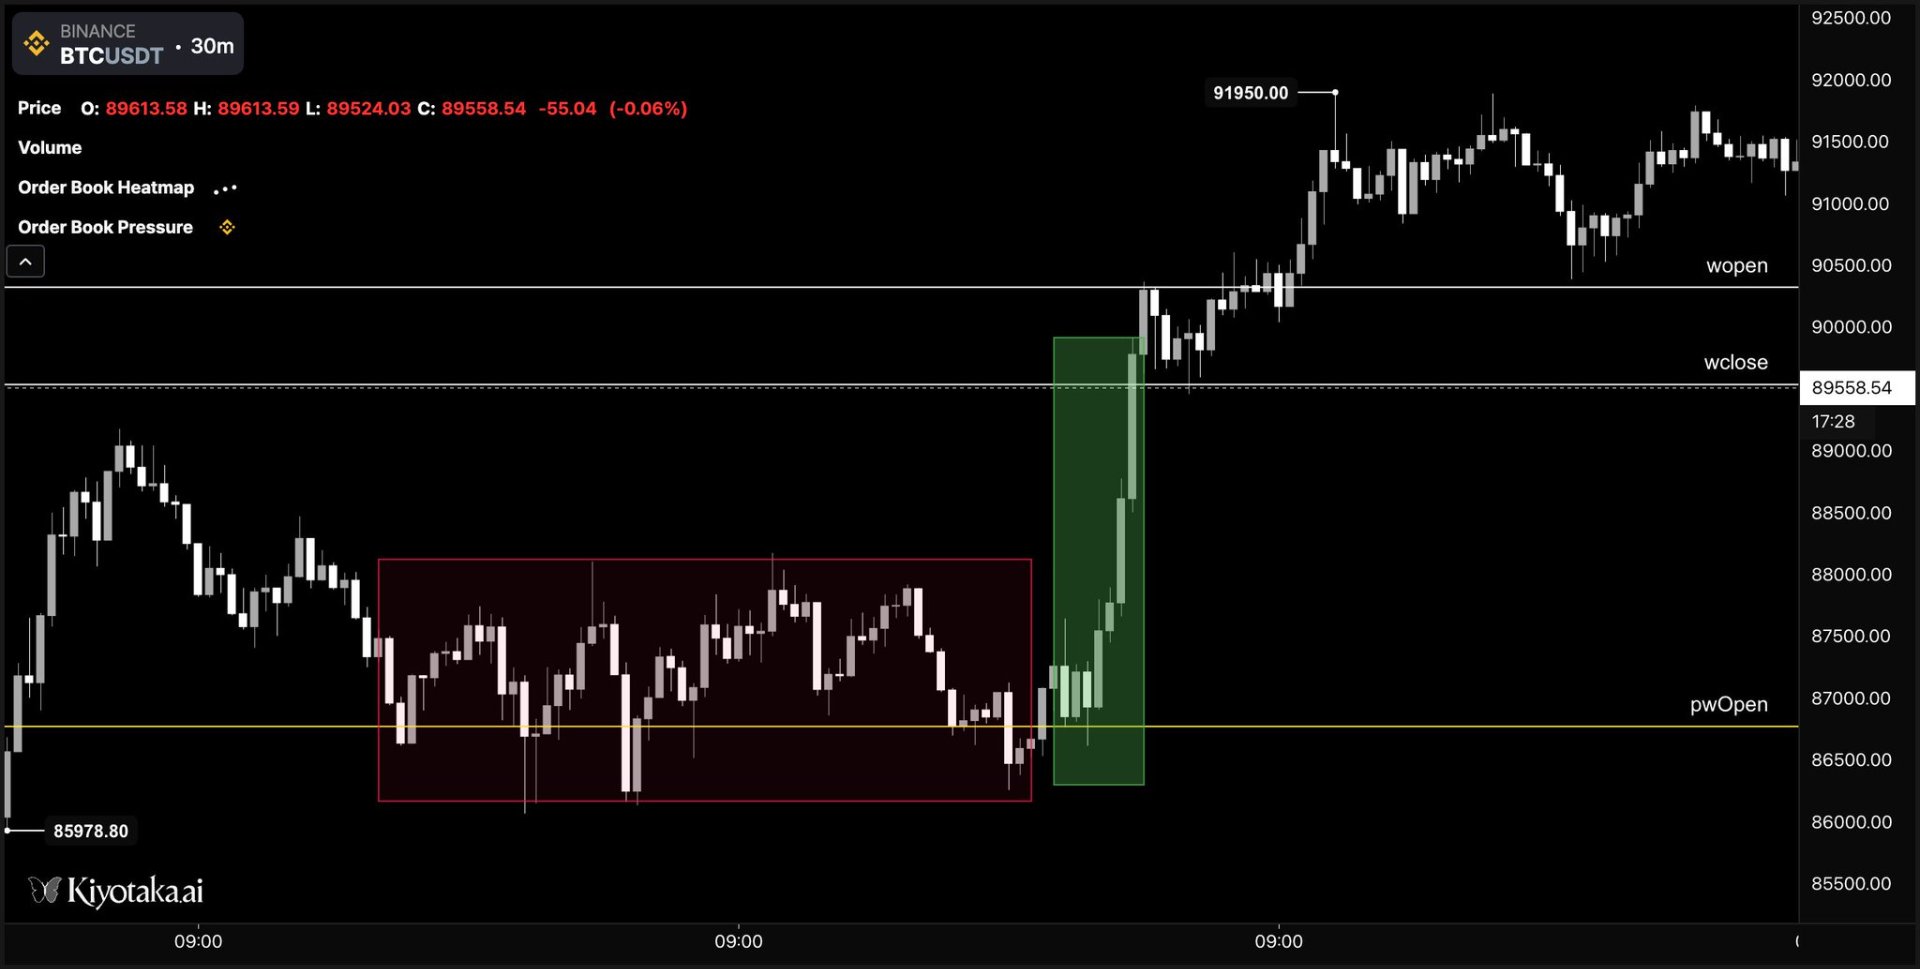
Good confirmation at 1:30 minutes mark, we can save 30 minutes and open our long position here.
In other instances, we have big ass candles so we can just ape after the 1hr close. Mind you, there are knife-catchers that might slow down the trend after a big ass candlestick.
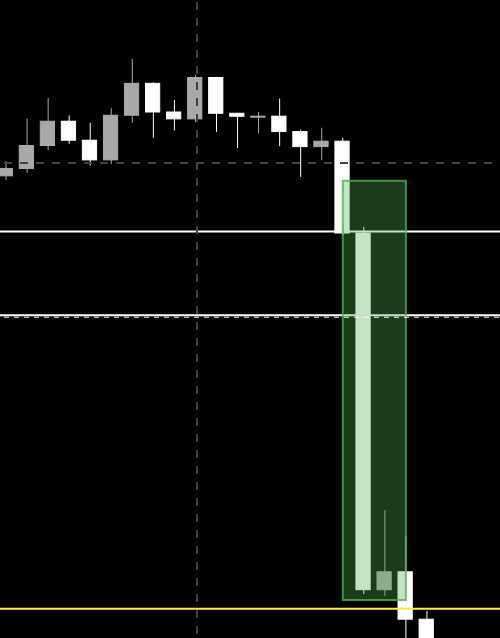
Quite decisive move, the sharp rejection on the pullback give us good chances of continuation for a short.
We need to pay attention to ranges, weak moves in a certain direction are NOT confirmations.
This sh*t is not a confirmation, quite the opposite. Do not touch.
- Since price travels to one S/R to another, the next S/R is a good place to take a profit. Mind you, someone might try to sell earlier. We call it "frontrunning". So price might reverse before it gets to the S/R. Watch your trades and consider exiting at market if that happens.
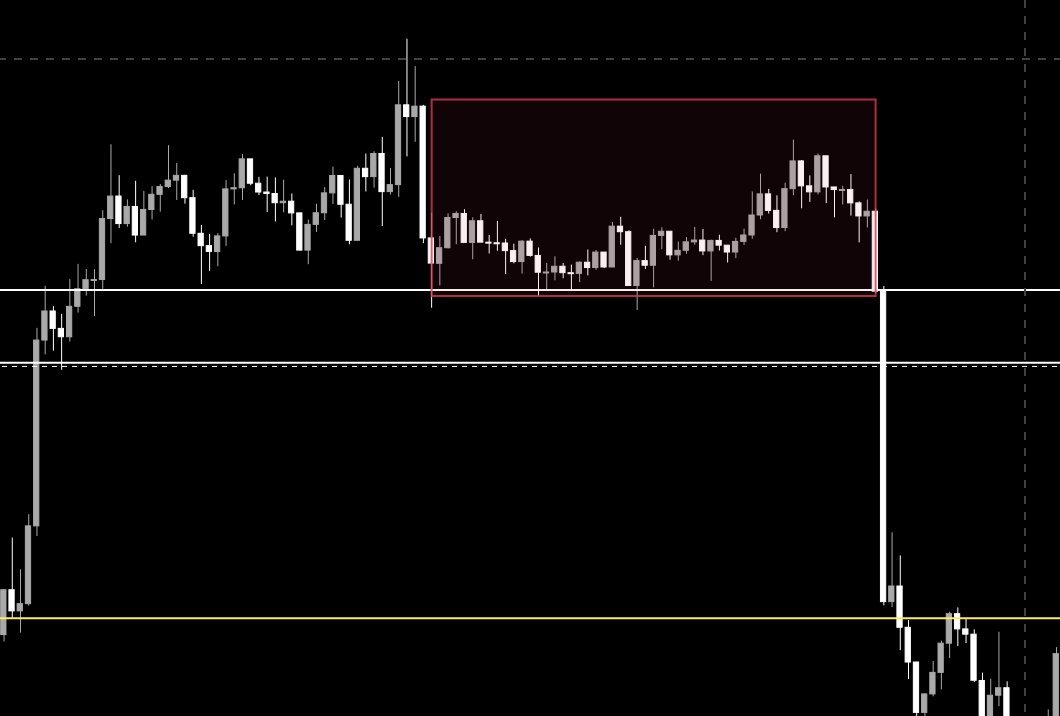
Sellers are frontrun in the red box, before S/R level.
Weak levels can see price pierce through much more easily, such as wO/C. Consider waiting before you take profit/close positions.
Self-explanatory, you already know you can take profit there, or even reverse position. I advise caution with both. Close a trade and reassess.
After a confirmation, we might see a pullback. Many participants place their stop loss exactly at the resistance. That's easy liquidity (orders) to be filled before moving in the expected direction. Set your stops LOWER/HIGHER.
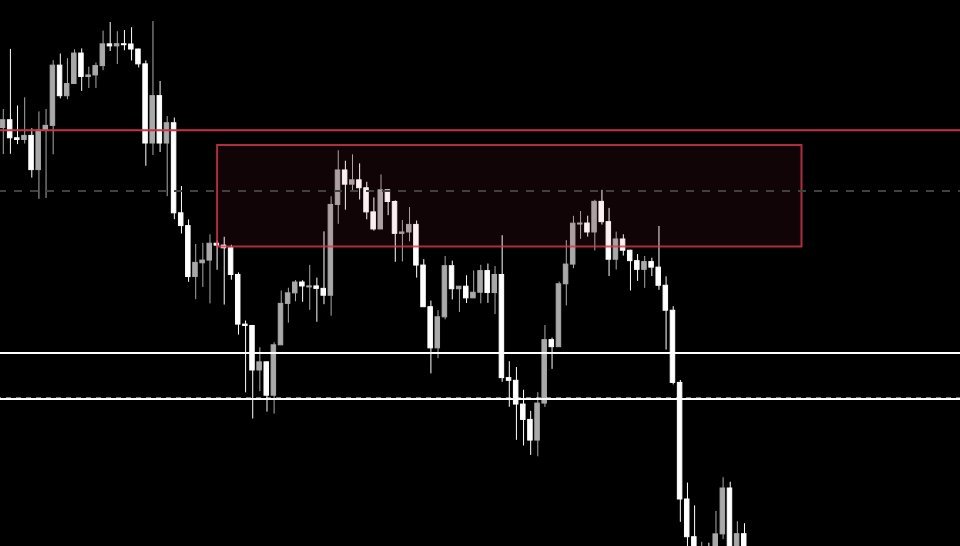
Green: potential long area
Red: pullbacks for liquidity. Stops should be set lower, on the green support.
3. Training
Now, I know most of you are impatient goblins that struggle to maintain an attention span of days, which is required to practice on these timeframes for day/swing trading.
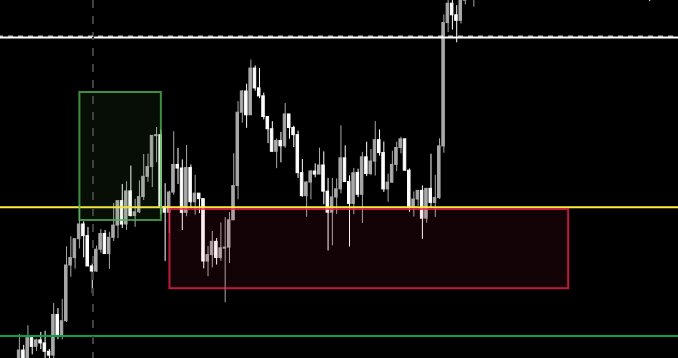
So what can we do? Well, we can use a 5-minute chart to train our brains. Just replace the weekly ranges with a daily range. The only difference is that I also highlight daily H/L together with O/C, and generally take a few days range.
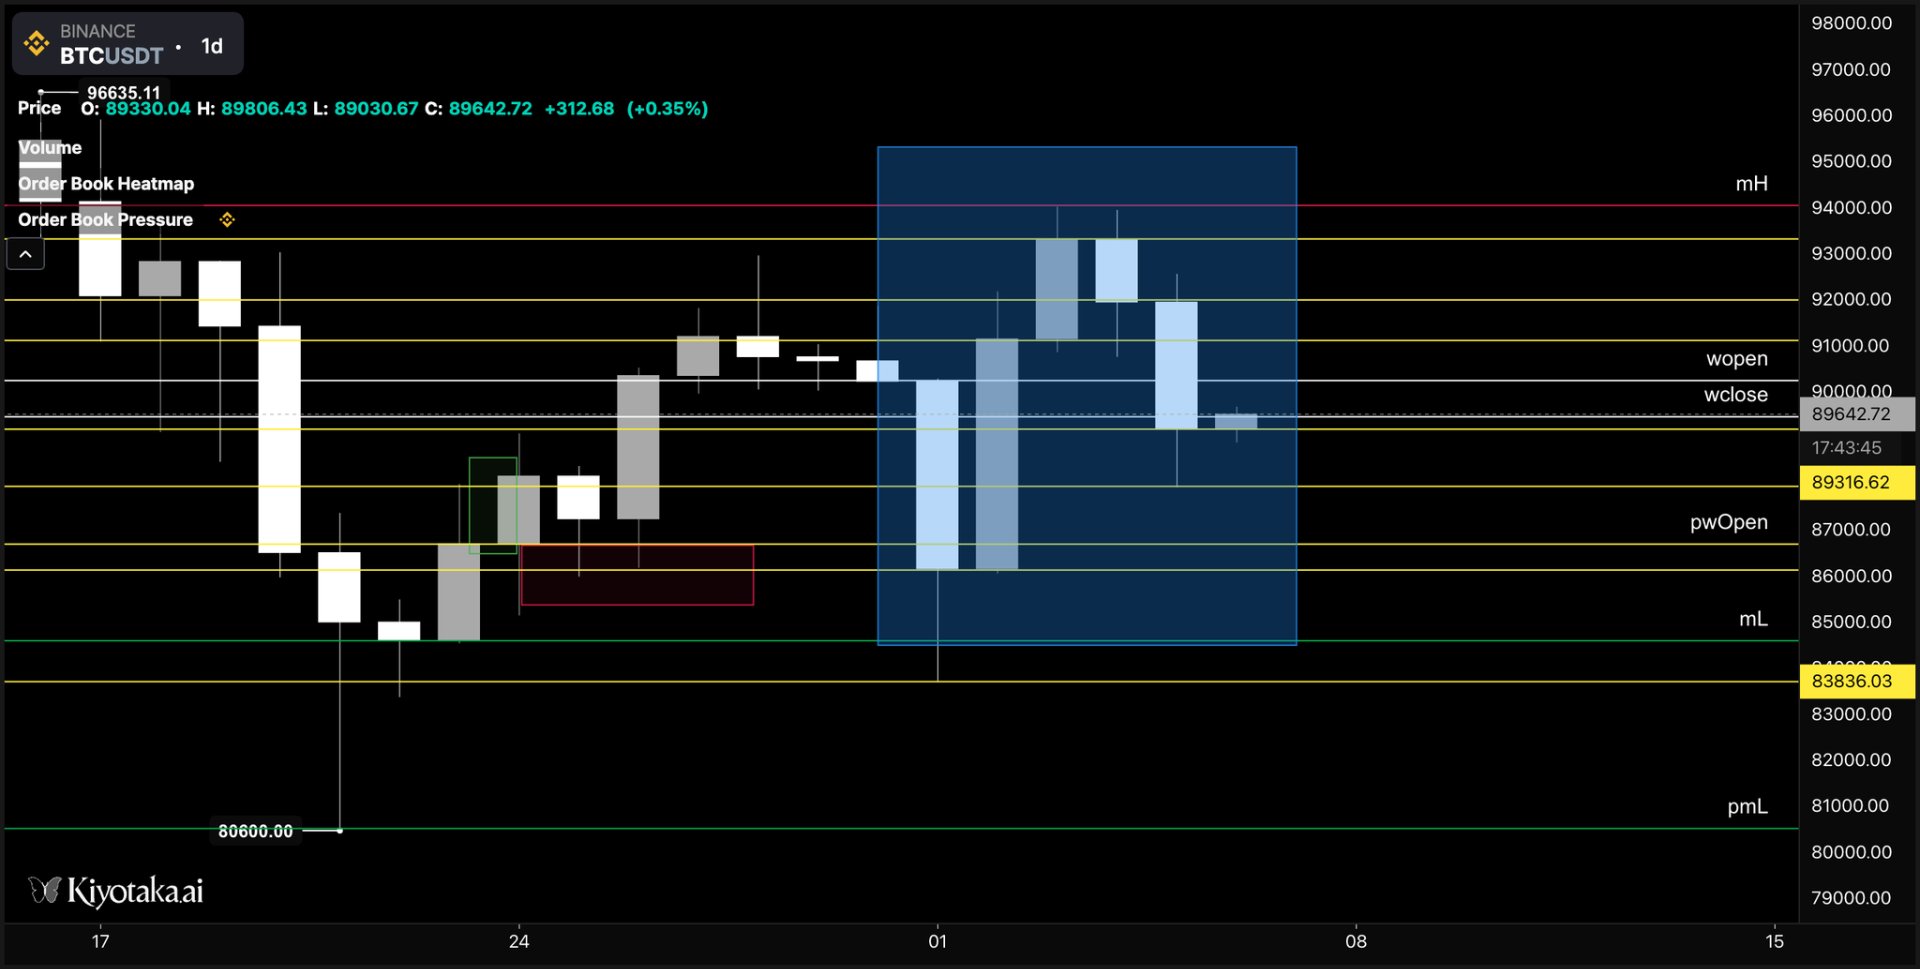
Here I highlighed the ranges for the days in the blue box.
Now zoom in to the 5-minute timeframe:
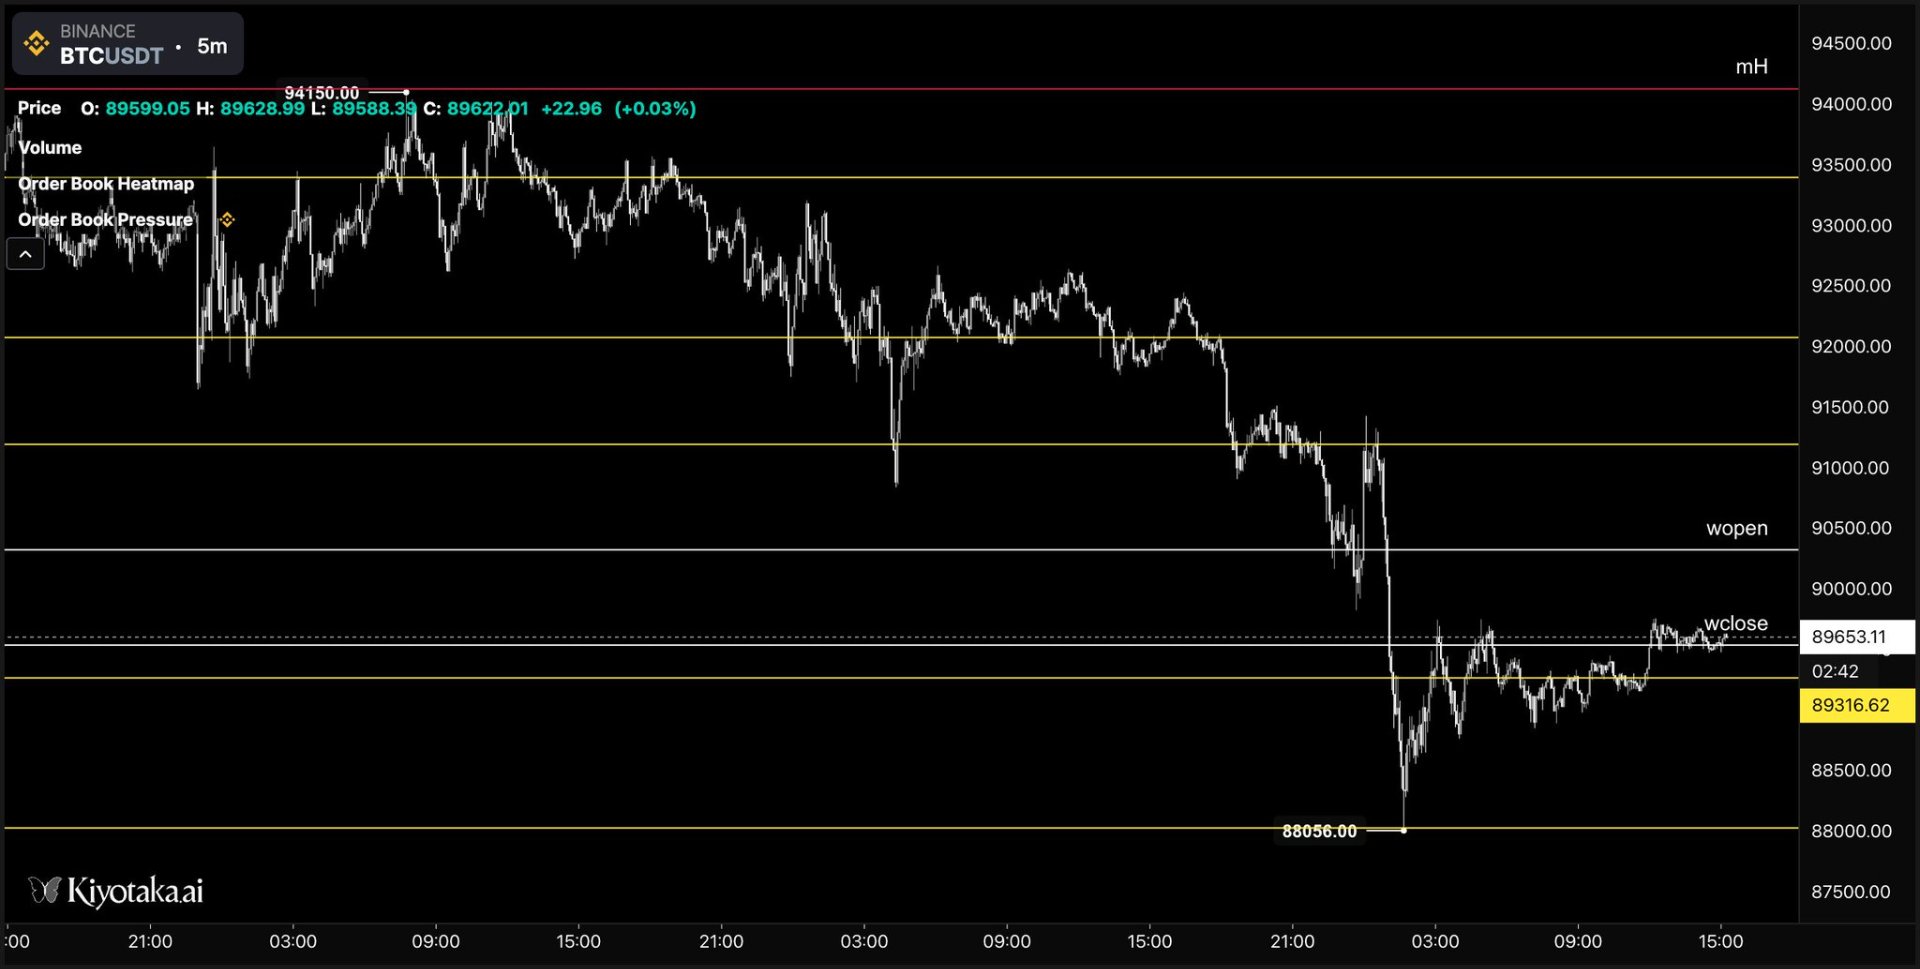
Scalping involves trading this stuff.
There you go, same stuff.
Take a few days to practice and observe.
Until next time.