Trading BTC Futures Using GEX
Why Options Matter To Futures Traders
Any discussion of markets structure must acknowledge the change that occurred around 2022. When SPX introduced daily expirations (0DTE). Options activity turned from a secondary hedging tool to a primary driver of short-term market behavior. Prior to 2022, options volume in both equities and crypto was dominated by longer dated contracts. This changes how gamma is distributed across price and time.
This shift matters because dealer gamma exposure now decays and reshapes much faster than before. Instead of relatively stable gamma that persisted across days or weeks, gamma regimes can now flip, form, and even disappear intraday. Thus increasing the relevance of tools like absolute gamma and gamma profiles, but at the same time, increasing levels of possible misinterpretation.
The post 2022 environment therefore rewards traders who treat GEX as a dynamic market force, rather than static price levels.
What GEX Changes in BTC Futures
GEX influences the behavior on price and how it will move. It influences whether PA is more likely to expand or compress, and whether mean reversion or continuation should be expected. BTC futures are driven by a mix of discretionary flow, liquidation mechanics, and algorithmic hedging. GEX sits at the intersection of these forces, affecting dealer hedging behavior in the options market, which then translate into spot and perpetuals through delta hedging.
Where GEX Comes From
GEX is derived from options positioning. It measures how sensitive dealers net delta exposure is to the change in the underlying asset. When dealers are long gamma, hedging behavior is stabilized, they sell into rallies, and buy into dips, which in turn dampens volatility. Whereas when dealers are short gamma, their hedging actually becomes destabilizing, as they must buy as price rises and sell as prices fall, increasing volatility and amplifying moves. For a BTC futures trader, the relevance of GEX lies directly in this response, dealers do not hedge options exposure with more options, but rather futures and spot. Gamma affects regular flows. It can shape how price reacts to ordinary buying and selling, but cannot stop liquidation cascades, or any other irregular event.
Why Gamma Works Differently in BTC
A common mistake when applying gamma concepts to BTC is using the same rules and thought process used in equities. BTC trades continuously, has no centralized MM obligation, and is heavily impacted by leverage, funding, and liquidations. This means Gamma effects tend to happen in spurts, rather than being persistent. There are periods where options dealer hedging meaningfully suppresses volatility, and periods where it is irrelevant. Gamma tends to matter most when the market is already calm and balanced, one with low funding stress, low liquidations, and price moving on discretionary and algorithmic flow.
Using Absolute Gamma
Absolute Gamma should be treated as a hedging power gauge rather than a simple support and resistance. High absolute gamma implies that small price changes induce large hedging responses from dealers, meaning points with higher most absolute gamma are more sensitive to movement. Price is more likely to rotate, stall, or not continue past the level because dealer hedging is actively countering price movement, making them stronger support and resistance points.
Low Absolute Gamma implies the opposite, hedging is weak, and price is more free to move through these levels based on other forces such as spot demand, funding imbalances, or liquidation cascades.
Low Absolute Gamma levels should definitely not be looked at as probable bounces.
Using Gamma To Filter Regimes
Gamma does not tell where price will go, but strongly biases how it will get there. Using the Gamma profile, in a positive Gamma regime, the default expectation should be mean reversion and suppressed volatility. Moves are likelier to stall, or retrace, rather than continuing. Breakouts require sustained acceptance to proceed, and failed moves are common.
In a negative Gamma regime, volatility widens, moves are stronger, and counter trend trades are disadvised.
Importantly, these are not guarantees, but more probabilistic shifts. You should be not using this to predict turns and bounces, but rather to better your risk management and trade selection, based on your expectations and other factors if the market will reject or continue a move.
GEX by Strike vs Gamma Profile
GEX by strike and gamma profile answer two different questions.
GEX by strike shows where gamma exposure is currently concentrated at specific prices, given the existing options open interest. This is best understood as where hedging pressure exists right now, at the current level. These can help explain why price stalls, rotates, or slows as approaching certain levels, particularly in positive gamma where hedging is amplified and volatility is decreased.
Gamma profile models how net gamma exposure would change if price were to move across a range of levels, simply, it is an estimation. Most commonly calculated through Black Scholes. Gamma flip using the profile is not a support or resistance level, it is a probabilistic regime shift. It changes the odds of how price should move after crossing Gamma negative to positive, or vice versa, and only if the flip is accepted.
Max Pain
Max pain represents the level in which both calls and puts collectively experience the greatest loss at expiration. People often like to talk about it as a magnetic force, but it should not be used as a predictive target. Market makers may hedge their positions in a way that is most profitable for them, and least profitable for option buyers. It's influence tends to increase closer to expiration (4 hours in particular for BTC), and especially during low momentum and low liquidity conditions (weekends) where hedging can dominate low volume conditions. When volatility is elevated or price becomes driven by spot-led flows, or any other factor, max pain often becomes irrelevant. If used correctly, max pain can tell where price may go in calm market conditions, in the final hours leading up to UTC 00:00.
Translating GEX by Strike and Gamma Profile into Chart-able Levels
Gamma profile and GEX by strike should not be plotted or interpreted as conventional support and resistance levels, but they can be translated into meaningful zones of expected behavior.
For most intraday trades, you can choose the following dates expirations, nearer dated options have higher gamma sensitivity, whereas far dated options have a slower, less immediate hedging response. There are several other nuances I won't overcomplicate things with, such as using options open interest with GEX, which expirations have gamma concentrated near current price, and understanding why certain contract dates matter more than others, I will leave that to you. I am boiling this down to incredibly simple concepts, so any experienced options traders, bear with me.
As I was writing this article, a perfect example appeared. (Dec 21, 2025)
GEX by Strike. Best used for intraday price levels and hedging interest.
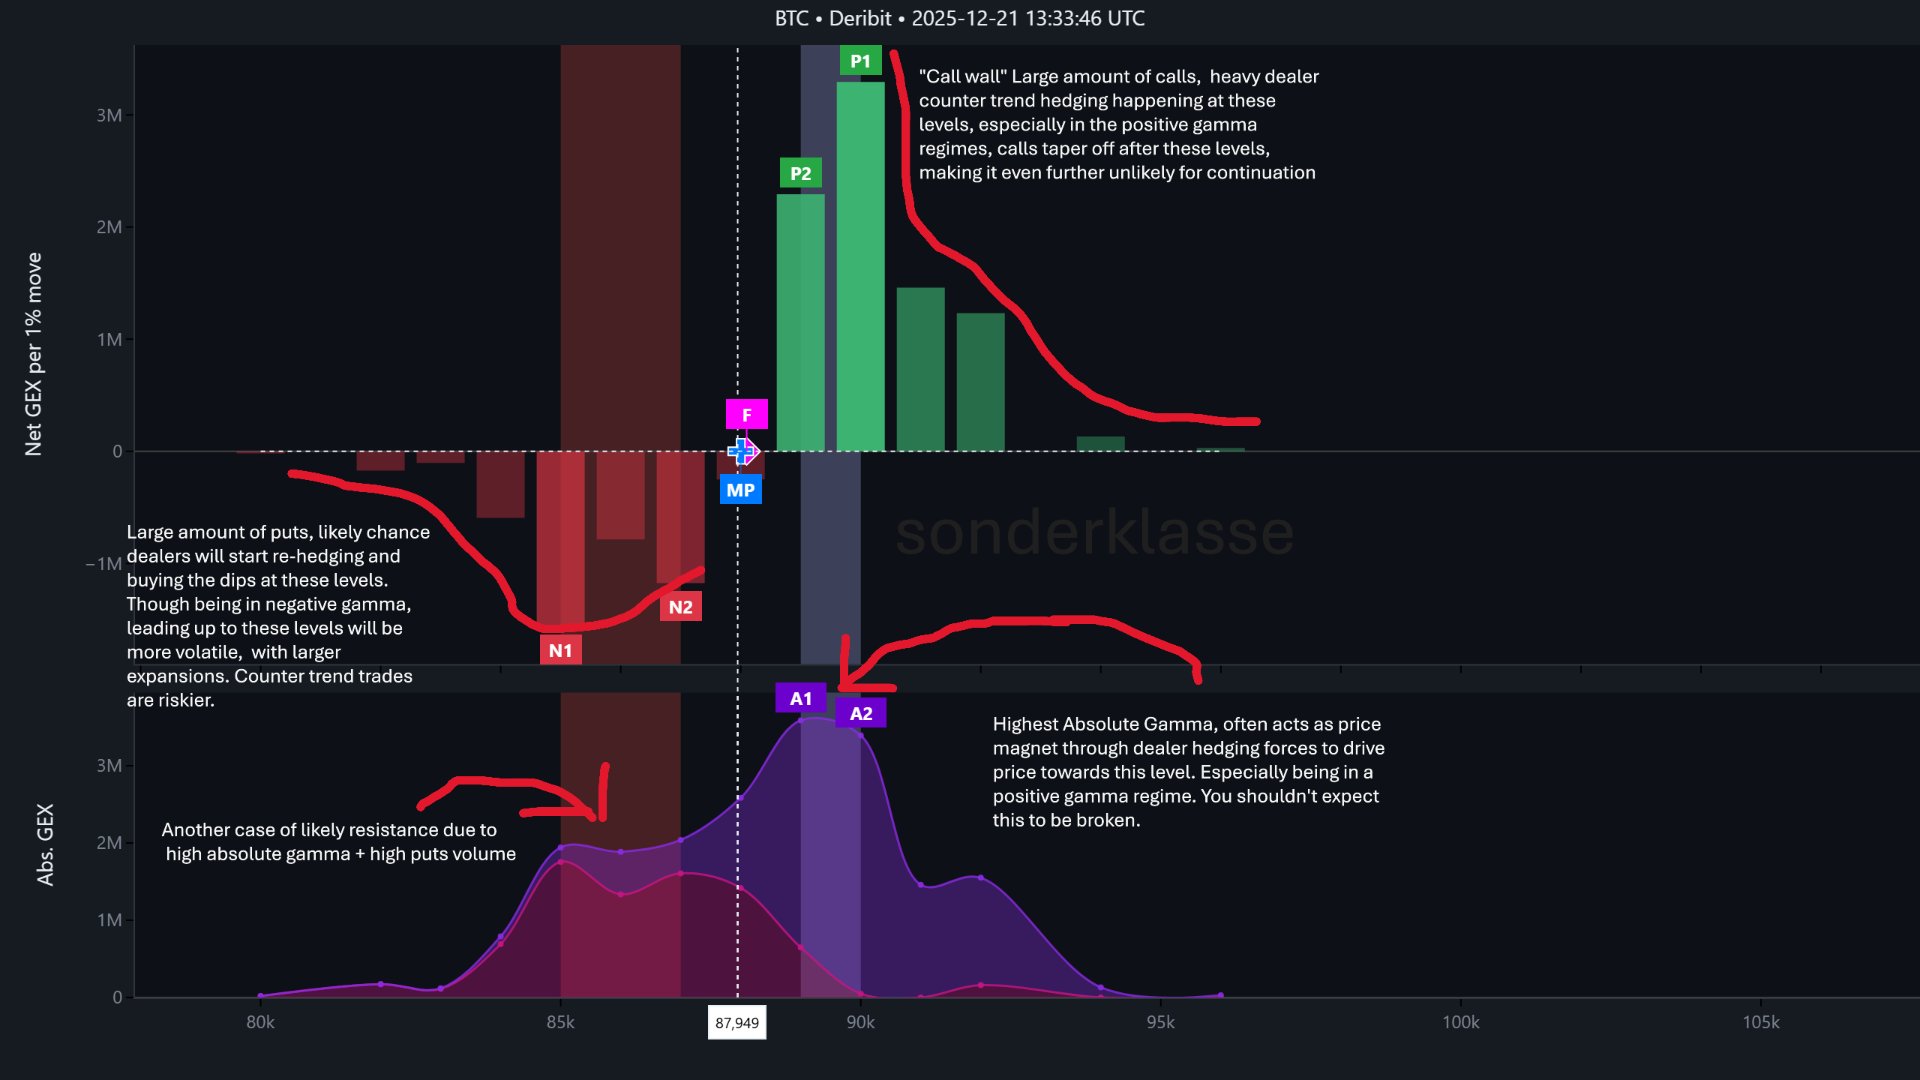
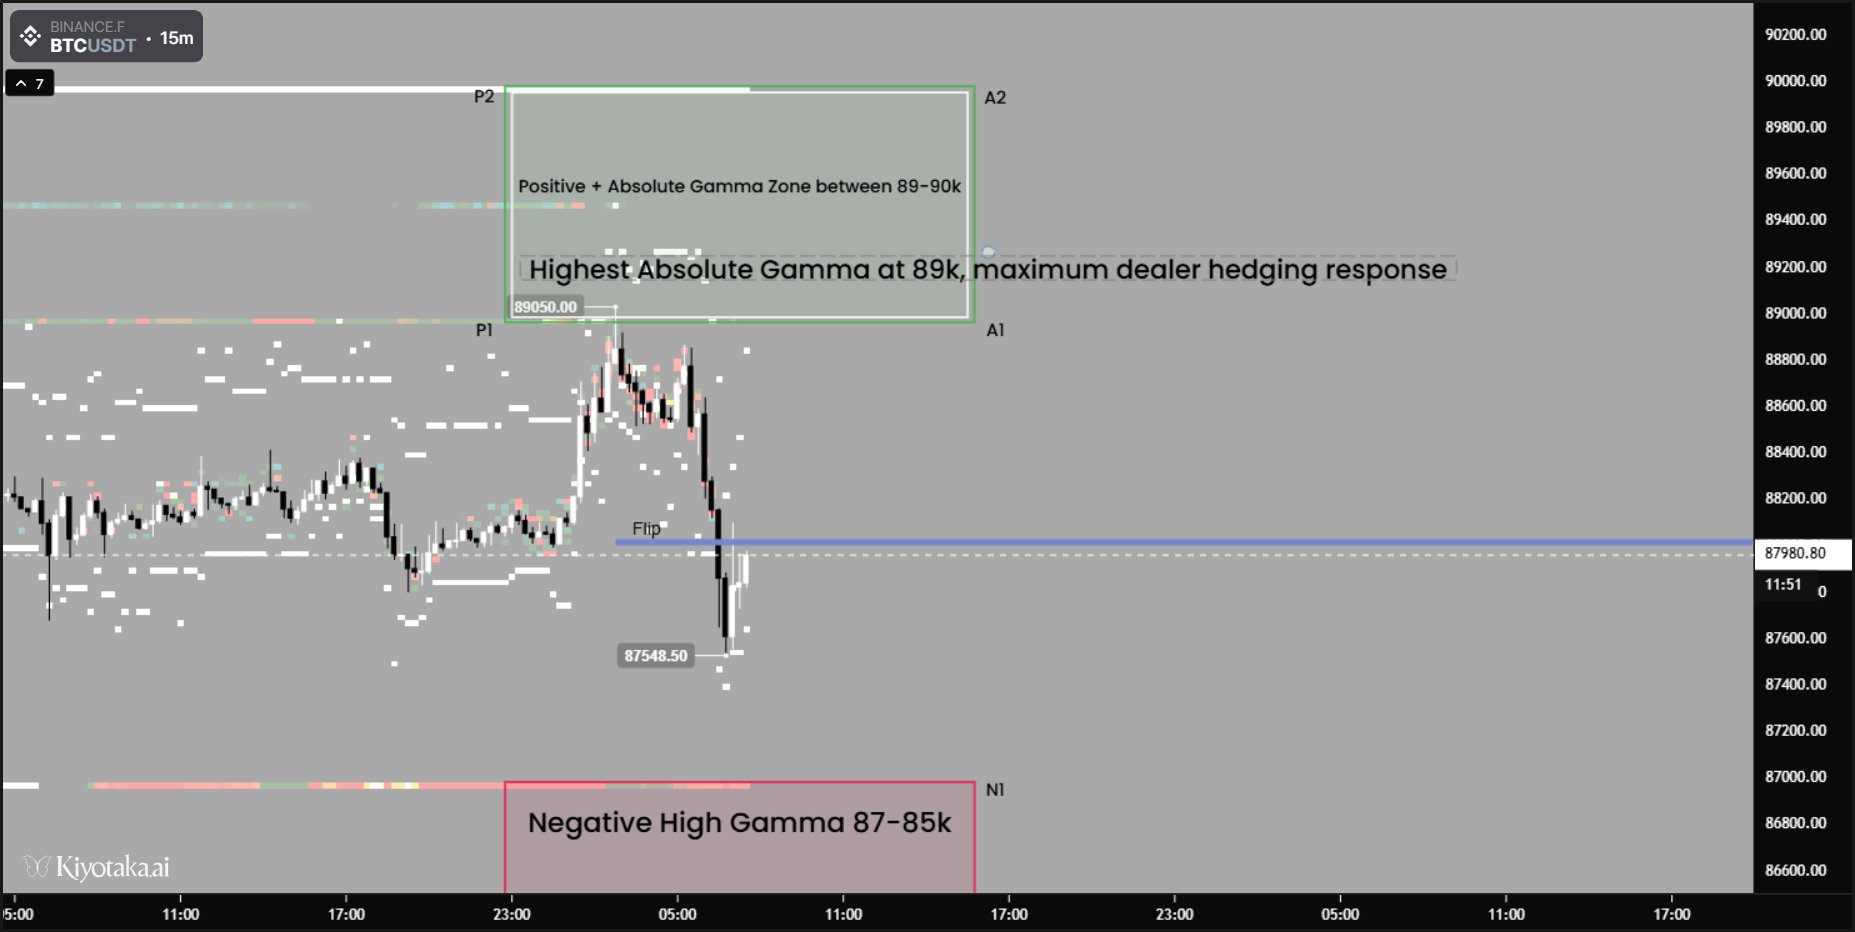
Price initially shot up to this level, but was quickly stopped due to amplified market maker hedging. Especially being in a positive regime, where market makers are constantly trading against the market, lessening volatility, and decreasing the likelihood of continuations, with this level of 89 seeing the absolute most hedging activity. You can see the Negative, Absolute, and Positive Ranges labelled on the chart below. (N1, A1, P1)
Gamma Profile
Better used as a signifier of when a true regime shift takes place.
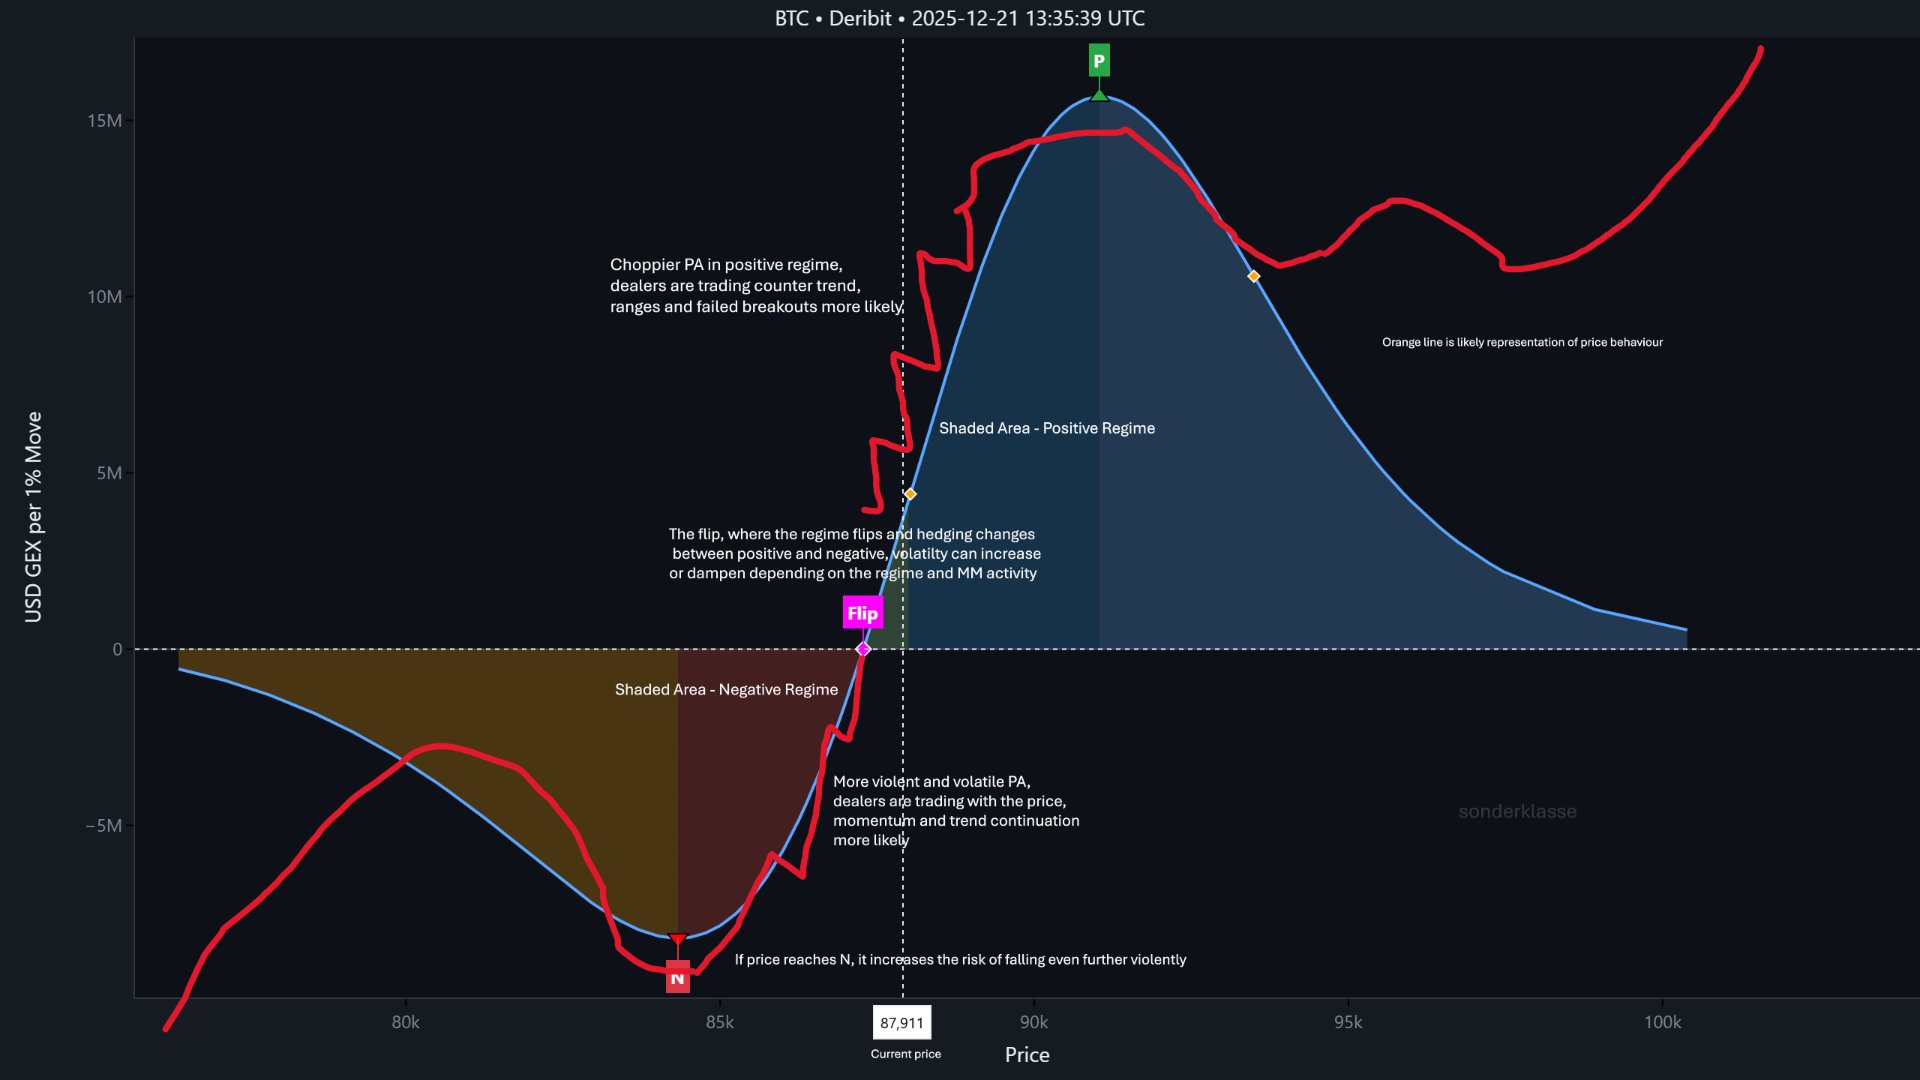
I made a mistake in the drawing., when price surpasses below N based on this chart, it will actually stabilize more, and see less volatility as gamma gets closer to a positive value.
Summarizations/Cheat Sheet
Understanding GEX gives you 2 distinct advantages
Identifying key levels - Put walls where dealers buy dips, call walls where dealers sell rallies
Predict volatility regimes - Positive net GEX = Low vol, Negative net GEX = High vol
Net GEX
Positive: Dealers are net long gamma = low volatility
Negative: Dealers are net short gamma = high volatility
Near 0/Flip: Gamma flip point = Regime transition zone
Call and Put GEX
Call GEX (Positive): Represents dealer long call positions, creates resistance to upside, dealers sell into rallies, and buy into dips, stabilizing them and lessening volatility. More likely to see ranges than trends.
Put GEX (Negative): Represents dealer short put positions, creates support on downside (both upside and downside breakouts are likelier) dealers sell into dips, and buy into rallies, accelerating them. More likely to see trends both up or down.
High/Low absolute gamma:
High absolute GEX: Trade put and call walls, they matter more
Low absolute GEX: Pay more attention to technical analysis and fundamentals in these areas
Increasing absolute GEX: Options activity growing, price becomes more important and higher chance of visiting
Decreasing absolute GEX: Options decreasing, less interest in these areas.
Think of net GEX similar to the "volume" of the gamma exposure. It tells you the direction of the force (high volatility vs low vol.) and absolute GEX tells you the strength of the level.
Gex by Strike and Gamma Profile
Gex by strike: Shows gamma exposure at current price using currently available data. Best for, spotting put/call walls, and identifying max pain.
Gamma profile: Shows how gamma hypothetically changes across a range of prices. Best for predicting hedging flows, and seeing genuine volatility regime shifts.
TLDR; Mean reversion in Positive GEX, Breakout trading in Negative GEX.
Hope you learned something, sonder